
We recommend you install the Client Component Pack on computers used to run and view reports. Without the Client Component Pack installed, users may experience errors caused by permissions or network security. These issues are outside the scope of UniVoIP Technical Support.
You generate reports in the following manner. These steps explain how to run a Voice Queue Group Performance by Period report.
NOTE:
-
Some reports are stored in SQL data tables as devices instead of intervals. Reports stored as devices cannot be run for a specific time range and can only be run 24-hour periods. If the Start Hour and End Hour options in CCMWeb are disabled, the report can be generated for 24-hour periods only.
-
If you run a report that results with Data Limit Exceeded in the inbox, you must re-run the report using a shorter time span.
-
Report feature availability varies by report type.
To generate a report
-
Hover over Reporter and select Voice=>Queue reports. The Basic tab opens. See Figure 3.
-
Under Report type, select the Queue Group Performance by Period report.
-
After Queue group, click one or more queue group. Hold down the <Shift> key or <Ctrl> key to select more than one queue group.
-
After Start date and End date, specify the start and end dates for the report.
-
NOTE: If you want one report that spans two days (for example, from December 3 at 9 P.M. to December 4 at 5 A.M.), then make the Start date and the End date the date the shift begins (December 3). If you make the Start date the date the shift begins (December 3) and the End date the date the shift ends (December 4), you will generate a report that spans three days (December 3 from 9 P.M. to December 5, 5 A.M.). The time span for each shift cannot exceed 24 hours.
-
-
If you are running a Conversation Detail Report or a Multimedia Trace report, to create an employee-level report plus reports for each of the employee's media types select Create one report for each of the employee's supported media servers.
-
To create a separate report for each day in the date range you selected, select the Create one report for each day in the selected date range check box.
-
After Start hour and End hour, specify the start and end hours for the report. NOTE: If you are running reports with the Over midnight Report mode option, the time span between the Start hour and the End hour cannot exceed 24 hours.
-
After Interval, specify the time interval in which the statistics will display in the report.
-
After Days to include, select the days of the week to include in the report.
-
If your contact center does not operate 24 hours a day, after Report mode, select Default.
-
To run a report over midnight, after Report Mode, select Over midnight. The Over midnight report mode is most appropriate for 24-hour contact centers.
-
After Report output language, select the language used in the report output.
-
After Render type, specify how you will view reports, either in Excel or .pdf format.
-
Click the Filter tab, if available for the report type selected.
-
Specify the filtering options to include in the report. Separate multiple values with commas. For example: Queue = P100,P200,P300.
-
Click the Distribution tab.
-
To email the report, after Email the report to specify to whom you will email the report:
-
A contact group, select this contact group and select a group
-
One contact only, select this contact and select a contact
-
One employee only, select this employee and select an employee
-
A contact that is not listed, select this email address, and type the email address You add contacts and contact groups to the Email to list under My options=>Contacts.
-
-
To print the report, select Print the report.
-
Click Submit. The Report submitted screen opens.
-
Click View Report Inbox. The Report Inbox window opens, listing all created reports.
-
Click View to open a report.
The report opens in the format you specified.
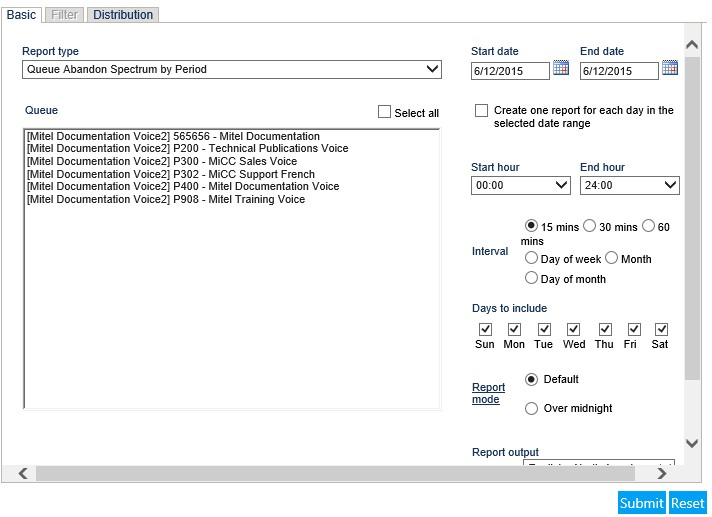
Figure 3: Reporter: Basic Tab