
1 Hour Summary
The 1 Hour Summary dashboard displays a graph of queue and agent activity across all voice queues.
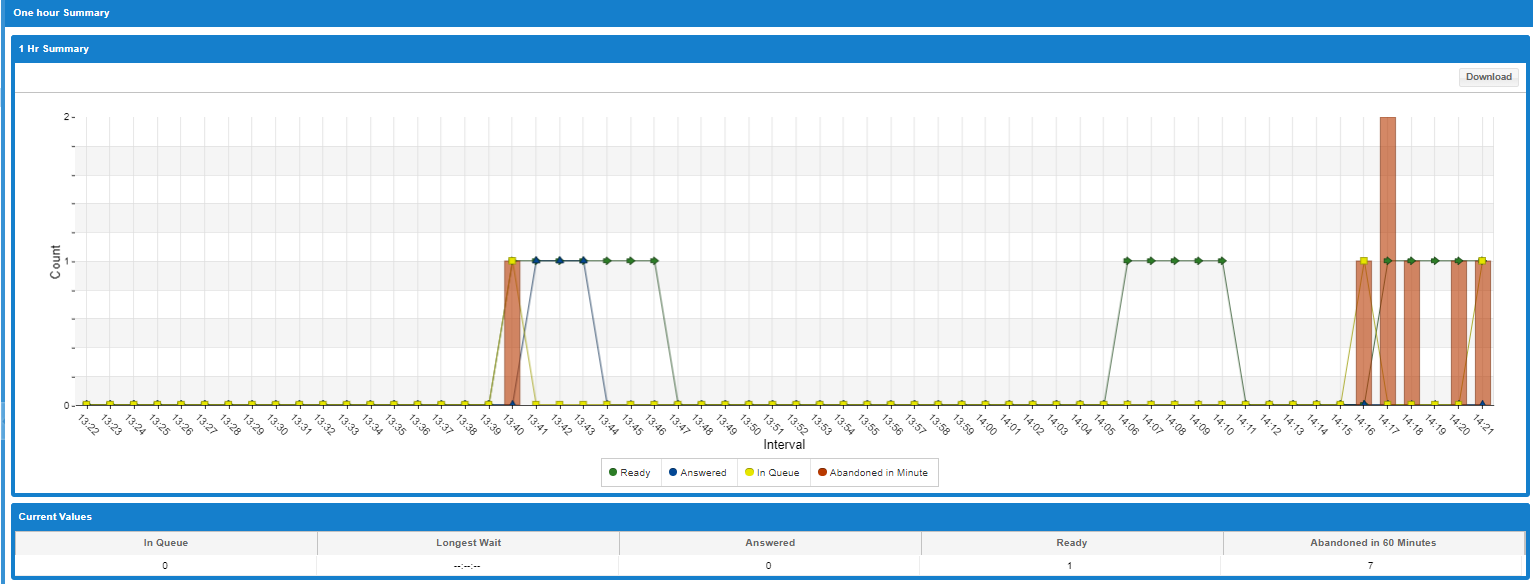
Field Definitions (Current Values)
-
In Queue: the number of callers currently waiting in queues.
-
Longest Wait: among all callers currently waiting in these queues, the longest time any of them has been waiting.
-
Answered: Total callers currently connected to answering agents.
-
Connected: the number of calls currently connected to agents.
-
Ready: the number of agents who are currently signed and ready.
-
Abandoned in Last Hour: the number of abandoned calls. This includes callers who hung up, callers who selected menu options, and calls that timed out. Excludes calls that were hung up within a few seconds of arriving.
The 60 minute graph on this page is updated once a minute. At that instant the graph plots:
-
Ready: the number of agents currently signed in and ready for queued calls.
-
Answered: the number of ACD calls currently connected to agents.
-
In Queue: the number of calls currently in queue waiting for an agent to answer.
-
Abandoned in Minute: the total number of calls abandoned during the previous full minute of operation.
Between the beginning and end of any single minute interval, the numbers of connected calls, ready agents, and calls in queue could vary widely. These variations would not show on this graph. However, those variations would be seen in the real-time table presented below the graph.
Displaying a sub-set of values
To hide any of the values displayed in the one hour summary, click the colored button next to the appropriate title box below the graph. In the following example, all values are shown.

In the next example, the Answered button is de-selected and that value is hidden.
