
Dashboard - Real Time Queue Statistics
To access Dashboards, click on Dashboards in the left navigation panel.
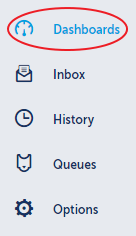
The main window will be populated by your Default Dashboard. Add one or more Widgets to the default dashboard to present you with real time Queue data.
Please note: You can also add additional Dashboards by clicking on the plus symbol.
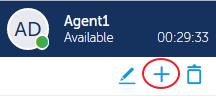
To add a Widget to a Dashboard
-
Click on the Edit Icon
-
-
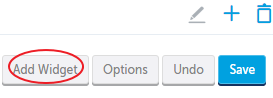
Click on "Add Widget"
-
-
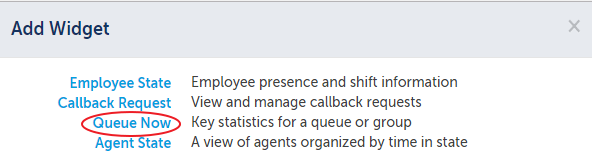
Click on "Queue Now"
-
-
Click on the Settings Icon for the Agent State Widget
-
-
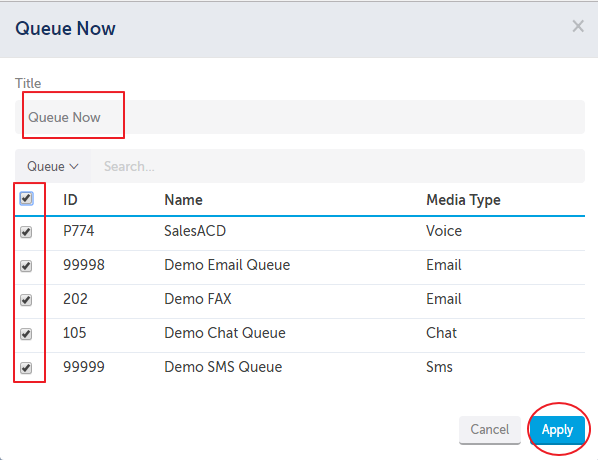
Change the Title if you want, select the Queues you want to see in real time, then click "Apply"
-


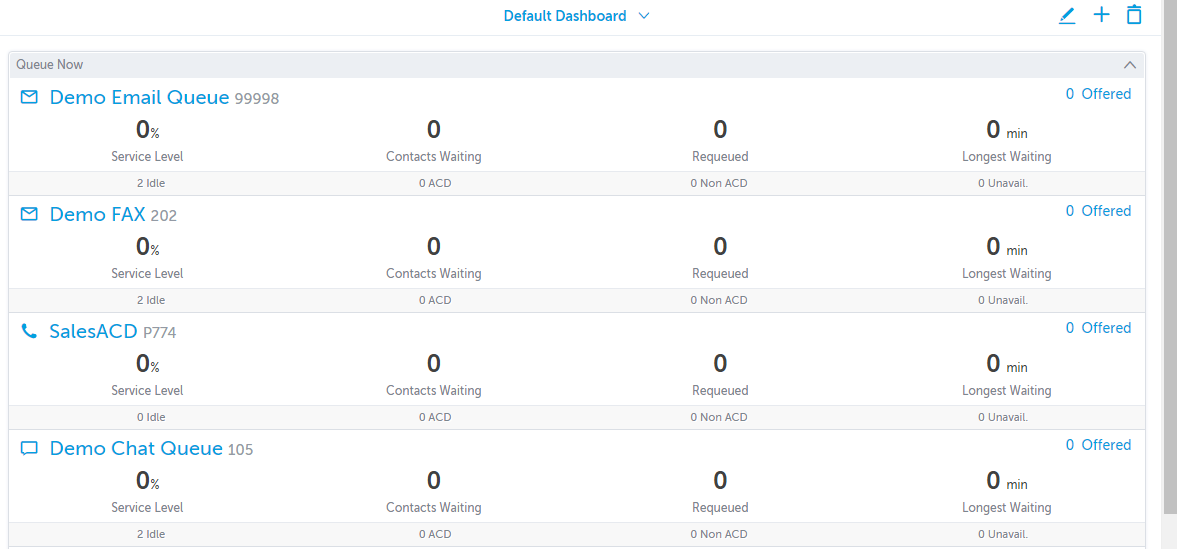
You now have a view of what the Queues are doing in real time from an ACD perspective.
Return to the Ignite Web Portal for Agents and Supervisors Main Menu