VOICE QUEUE REPORTS
Voice Queue and Queue Group reports provide statistics on individual queues and queue groups that reflect caller behavior and the service experienced by callers.
In report descriptions, the term 'members' refers to the individuals answering for the queue. For ACD paths, 'members' refers to agents in the queue's answering agent groups. For Ring Groups, 'members' refers to the extensions assigned to the Ring Groups.
Voice Queue reports apply to both ACD paths and Ring Group configurations. Within reports, these devices are differentiated by their reporting numbers. The reporting numbers of ACD paths always begin with 'P'.
Statistics not applying to Ring Groups are indicated in each report description and display as '0' in your reports. In Queue reports applicable to ACD paths only, Ring Groups do not display as reportable devices.
If you are running a voice report on a queue group that has non-voice members, the statistical values in the generated report will be for voice queues only.
Please note the following regarding Ring Group reporting statistics
- Hot desking users logging into Ring Group member extensions must also be a member of the Ring Group, to ensure accurate Ring Group reporting. For more information on configuring Ring Groups, see the MiContact Center Installation and Administration Guide.
- Ring Groups require a minimum of MiVoice Business 7.0. Customers running versions of MiVoice Business lower than 7.0 using Ring Groups may have real-time and reporting statistics populate based on their Ring Groups, but these statistics are not supported and will be inaccurate due to changes in the data provided by MiVoice Business.
The Queue reports are listed below:
Performance reports
• Queue and Queue Group Performance by Account Code
• Queue and Queue Group Performance by Member (You cannot generate this report over midnight.)
• Queue and Queue Group Performance by Day of Month
• Queue and Queue Group Performance by Day of Week
• Queue and Queue Group Performance by DNIS (You cannot generate this report over midnight.)
• Queue and Queue Group Performance by Month
• Queue and Queue Group Performance by Period
• Queue Group Performance by Queue
• Queue Group Performance by Queue Group - Multi-select NOTE: This report applies to ACD paths only. The report does not apply to Ring Group data.
• Queue Answer vs. Abandon Comparison NOTE: This report applies to ACD paths only. The report does not apply to Ring Group data.
By queue report
• Queue Group by Queue with Agent Information NOTE: This report applies to ACD paths only. The report does not apply to Ring Group data.
Spectrum reports. The spectrum reports provide a frequency distribution of calls abandoned, answered, or interflowed based on a defined time scale.
• Queue and Queue Group Abandon Spectrum by Period
• Queue Group Abandon Spectrum by Queue
• Queue and Queue Group Answer Spectrum by Period
• Queue Group Answer Spectrum by Queue
• Queue and Queue Group Handle Spectrum by Period
• Queue Group Handle Spectrum by Queue
• Queue and Queue Group Interflow Spectrum by Period
• Queue Group Interflow Spectrum by Queue
• Queue Ringing Spectrum and Queue Group Ring Time Spectrum by Period
• Queue Group Ring Time Spectrum by Queue
Internal/External reports
• Queue and Queue Group Internal/External Call Counts by Period
ANI reports
• Queue and Queue Group ANI by Area Code
Trace reports
• Queue and Queue Group Unavailable Trace
Voice Queue and Queue Group Performance by Account Code
The Queue and Queue Group Performance by Account Code reports show the use of Account Codes. (See Figure 41.) The Queue and Queue Group Performance by Account Code reports provide the following information:
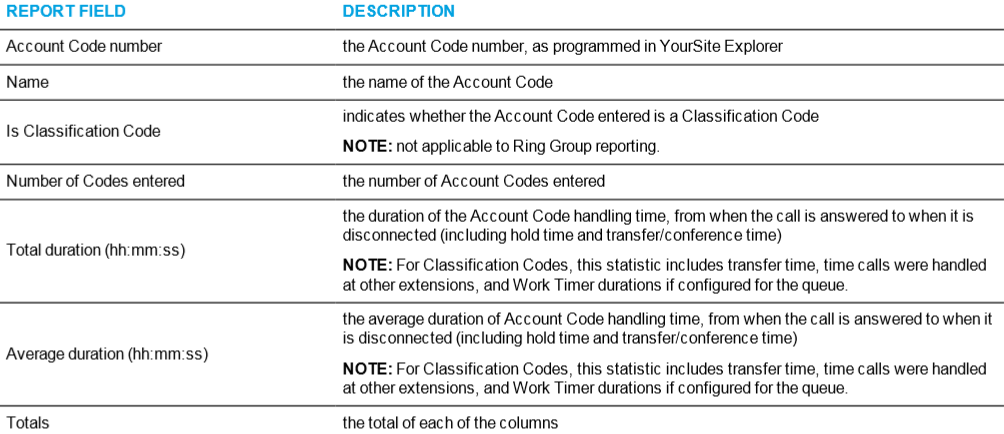
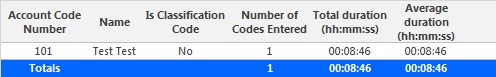
Figure 41: Voice Queue Performance by Account Code
Voice Queue and Queue Group Performance by Member
The Queue and Queue Group Performance by Member reports show the call performance of each member and therefore permit comparison of one member's performance against other members' performances. (See Figure 42.)
NOTE: Members answering calls, taking transferred calls, or taking part in conference calls from the queue will appear in this report even if the member is not associated to the queue or the queue group on which you are reporting.
The Queue and Queue Group Performance by Member reports provide the following information:
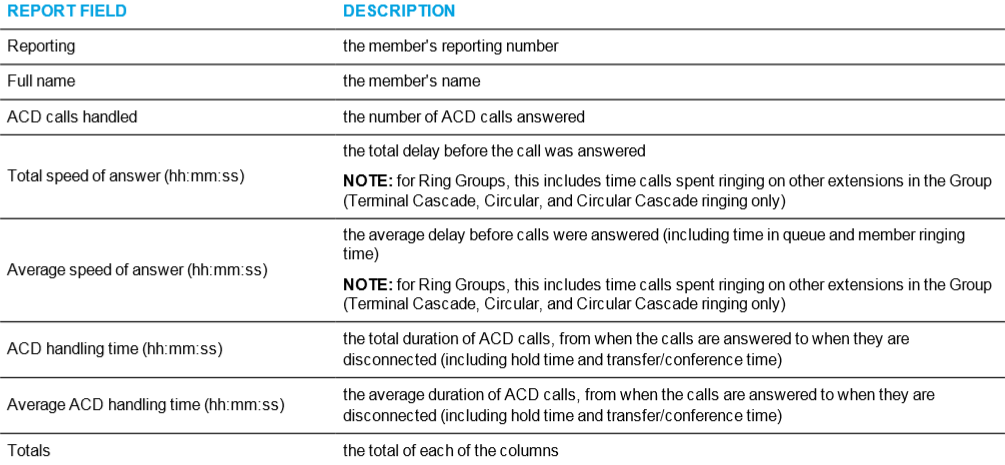
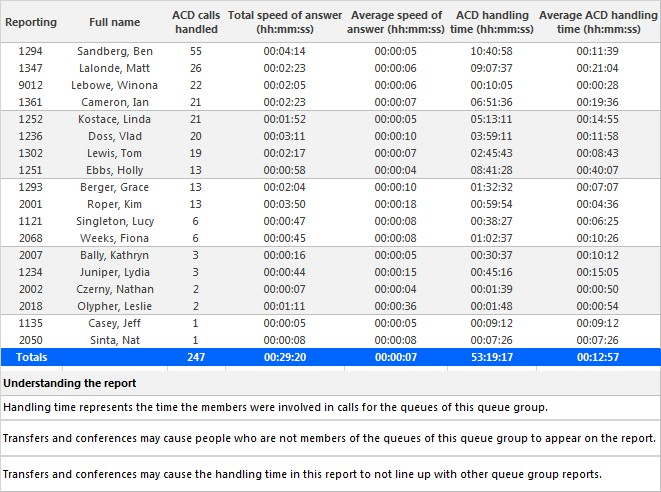
Figure 42: Voice Queue Performance by Member
Voice Queue and Queue Group Performance by Day of Month
The Queue and Queue Group Performance by Day of Month reports show the call performance of each queue or queue group for each day of one month. (See Figure 43.)
If your interflow statistic is zero, you probably did not program the telephone system with an interflow value. The Queue and Queue Group Performance by Day of Month reports provide the following information:
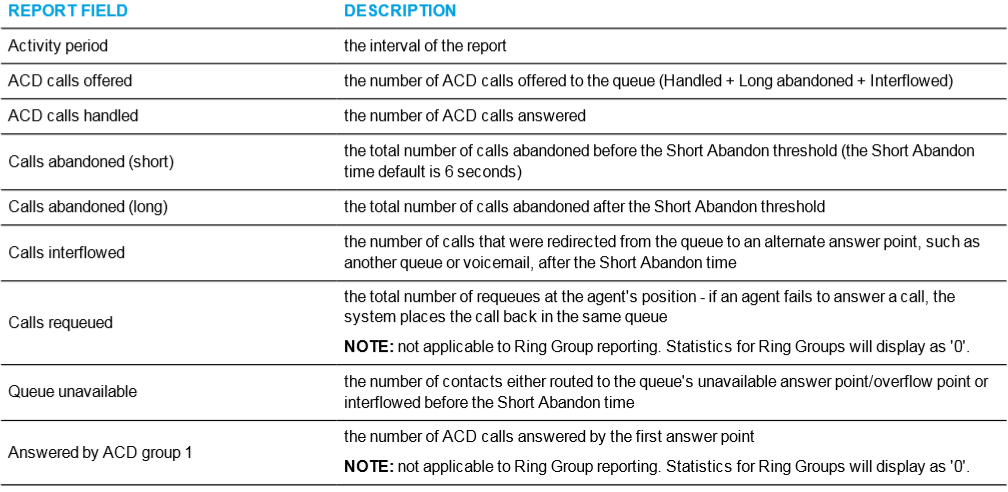
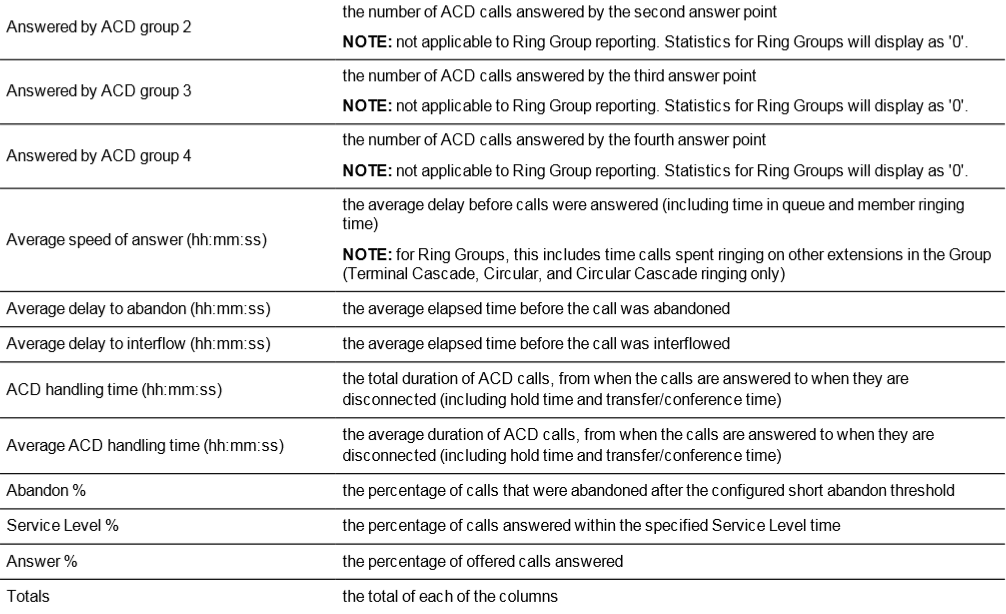
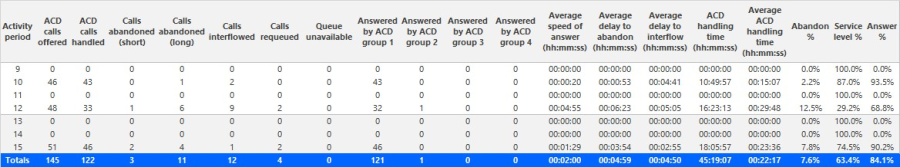
Figure 43: Voice Queue Group Performance by Day of Month
Voice Queue and Queue Group Performance by Day of Week
The Queue and Queue Group Performance by Day of Week reports show the call performance of each queue or queue group over the days of the week. When these reports are run for more than one week, the data are summed for each day of the week. For example, if the reports are run for two weeks, the data found under Monday represent the summed total of the two Mondays and the data found under Tuesday represent the summed totals of the two Tuesdays. (See Figure 44.)
If your interflow statistic is zero, you probably did not program the telephone system with an interflow value.
The Queue and Queue Group Performance by Day of Week reports provide the following information:
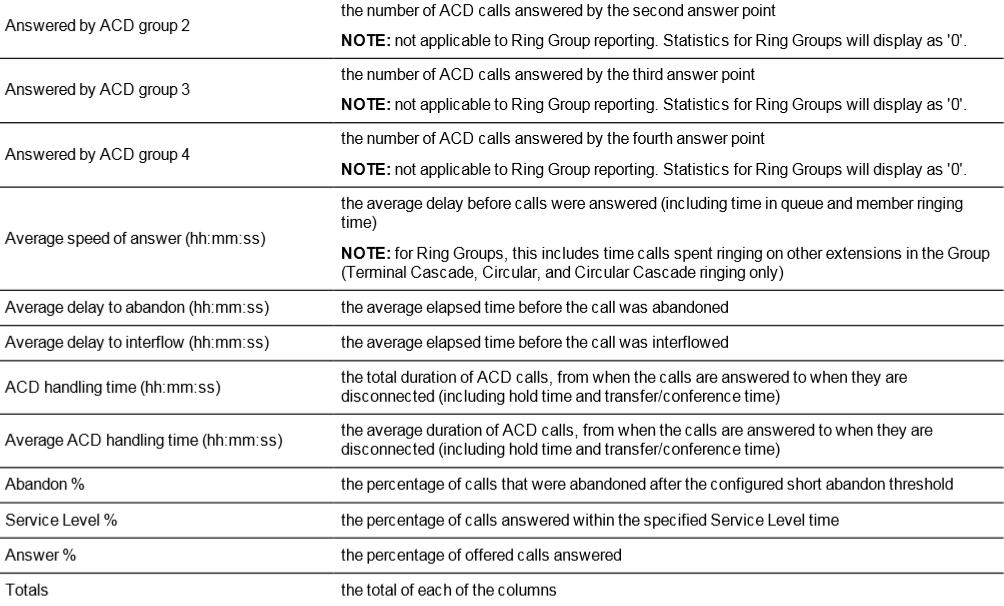
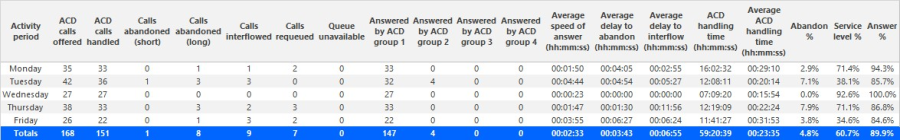
Figure 44: Voice Queue Performance by Day of Week
Voice Queue and Queue Group Performance by DNIS
The Queue and Queue Group Performance by DNIS reports show the call traffic on toll-free lines, and the treatment callers who dialed the toll-free lines received for the day(s) you specify. The reports show the call statistics in hours, minutes, and seconds, and provide call counts for the toll- free line. (See Figure 45.)
Dialed Number Identification Service (DNIS) is a feature of toll-free lines that identifies the telephone number the caller dials. Each toll-free line is tagged with a DNIS number.
If your interflow statistic is zero, you probably did not program the telephone system with an interflow value.
The Queue and Queue Group Performance by DNIS reports provide the following information:
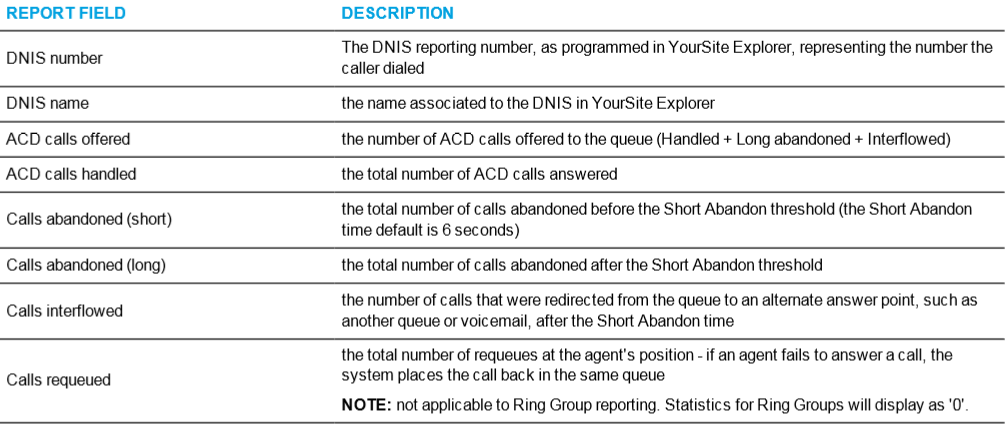
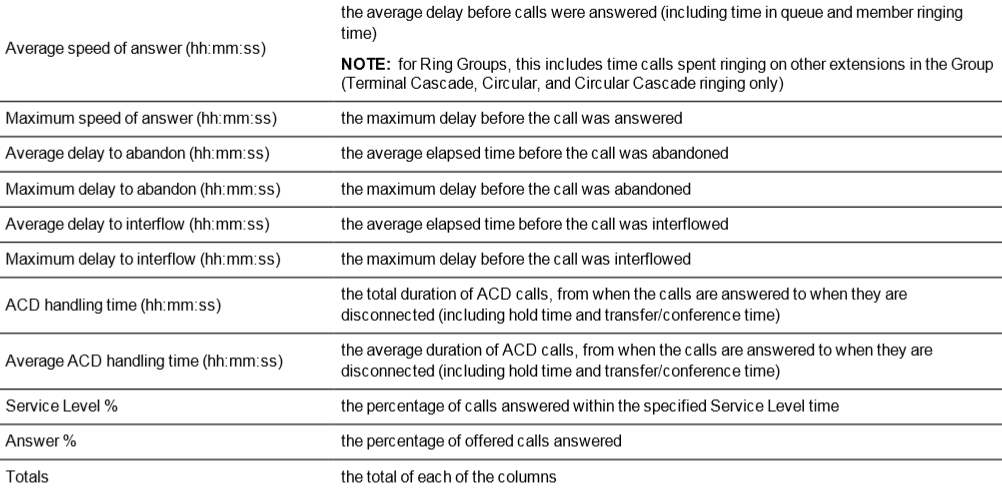
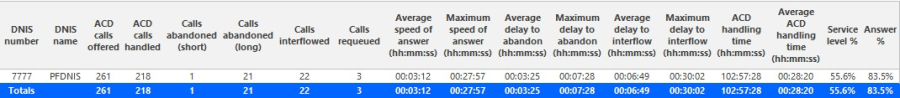
Figure 45: Voice Queue Group Performance by DNIS
Voice Queue and Queue Group Performance by Month
The Queue and Queue Group Performance by Month reports show the call performance of each queue or queue group for one month. (See Figure 46.)
If your interflow statistic is zero, you probably did not program the telephone system with an interflow value.
The Queue and Queue Group Performance by Month reports provide the following information:


Figure 46: Voice Queue Performance by Month
Voice Queue and Queue Group Performance by Period
The Queue and Queue Group Performance by Period reports show the call activity of a queue and queue group across 15-, 30-, or 60-minute intervals, for the shift duration and day(s) you specify (See Figure 47.)
If your interflow statistic is zero, you probably did not program the telephone system with an interflow value.
The Queue and Queue Group Performance by Period reports provide the following information:
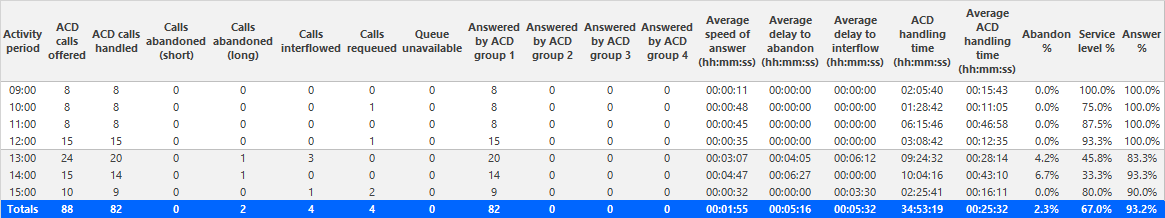
Figure 47: Voice Queue Performance by Period
Voice Queue Group Performance by Queue
The Queue Group Performance by Queue report compares the workload distribution across the queues in a queue group for the shift duration and day(s) you specify. It reports the call statistics in hours, minutes, and seconds, and provides call counts across queues. (See Figure 48.)
NOTE: The Queue Group Performance by Queue report can contain up to a maximum of 1,000 queues in one report. If your interflow statistic is zero, you probably did not program the telephone system with an interflow value.
The Queue Group Performance by Queue report provides the following information:
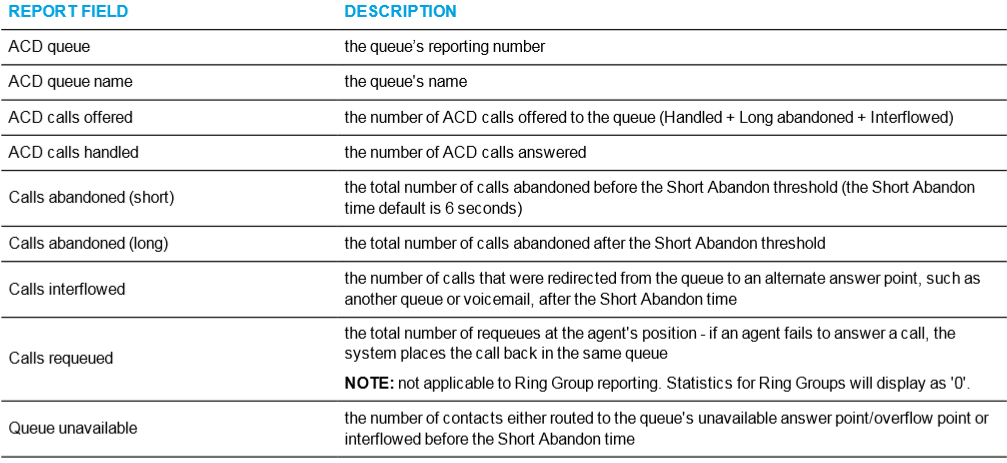
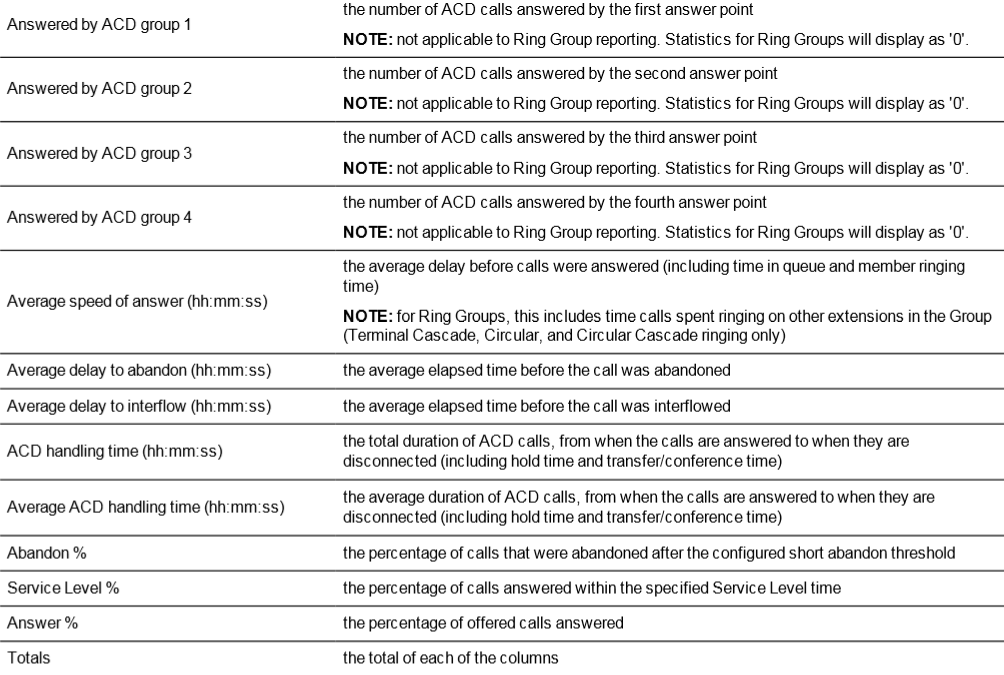
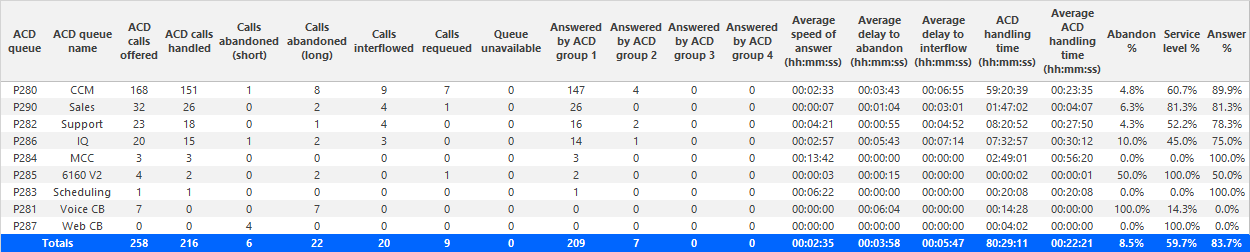
Figure 48: Voice Queue Group Performance by Queue
Voice Queue Group Performance by Queue Group - Multi-select
The Queue Group Performance by Queue Group - Multi-select report compares performance statistics across queue groups for the date, time intervals, and day(s) you specify. It reports the call statistics in hours, minutes, and seconds, and provides call counts across queue groups. If you want to view multiple queue groups in one report, select the Voice Queue Group Performance by Queue Group - Multi-select. Each selected queue group will display on one row of the report. (See Figure 49.)
NOTE: This report applies to ACD paths only. The report does not apply to Ring Group data.
The Queue Group Performance by Queue Group - Multi-select report provides the following information:
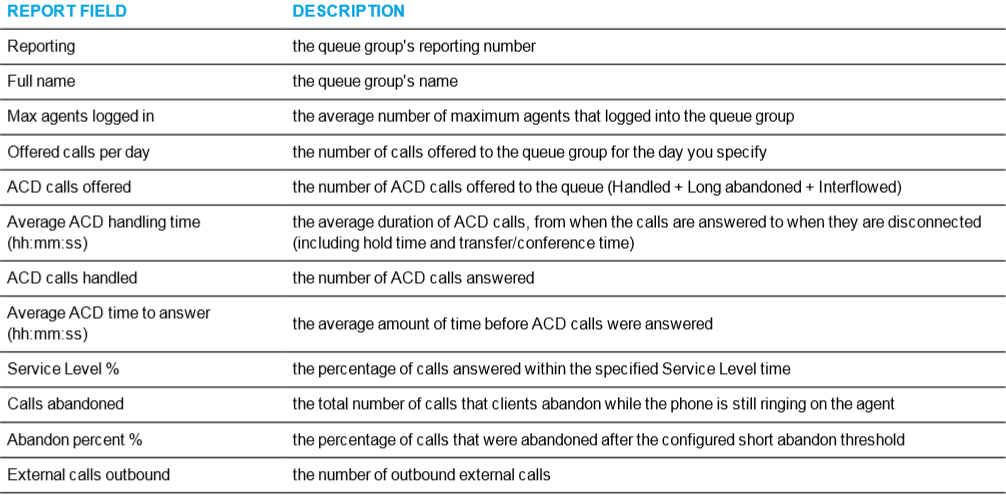
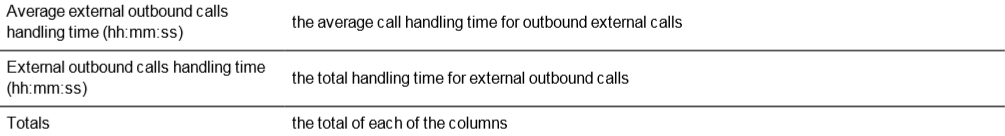
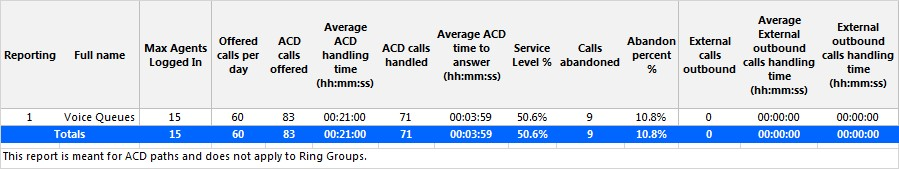
Figure 49: Voice Queue Group Performance by Queue Group - Multi•select
Voice Queue Abandon vs. Answer Comparison
The Queue Abandon vs. Answer Comparison report shows whether abandoned calls were reattempted and answered during the reporting period. (See Figure 50.)
The report displays abandoned calls for the first day of the reporting period and indicates whether these calls were reattempted and answered during the remainder of the reporting period.
NOTE: This report applies to ACD paths only. The report does not apply to Ring Group data.
The Queue Abandon vs. Answer Comparison report provides the following information:
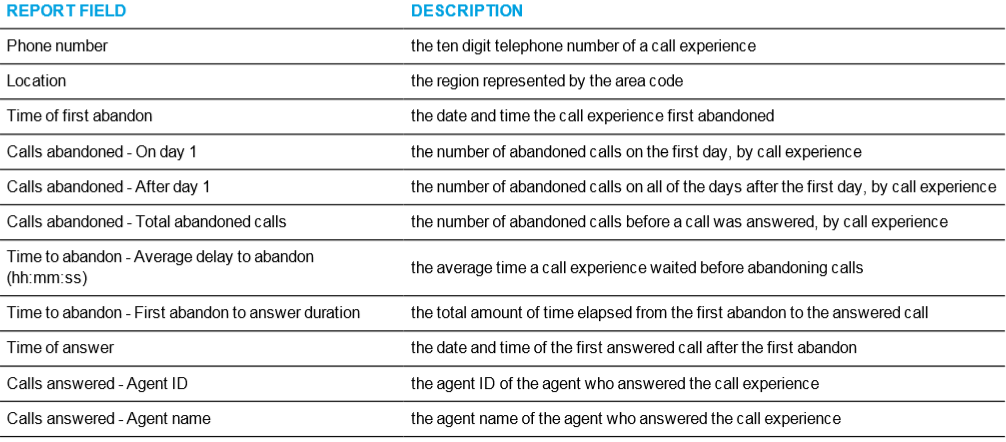
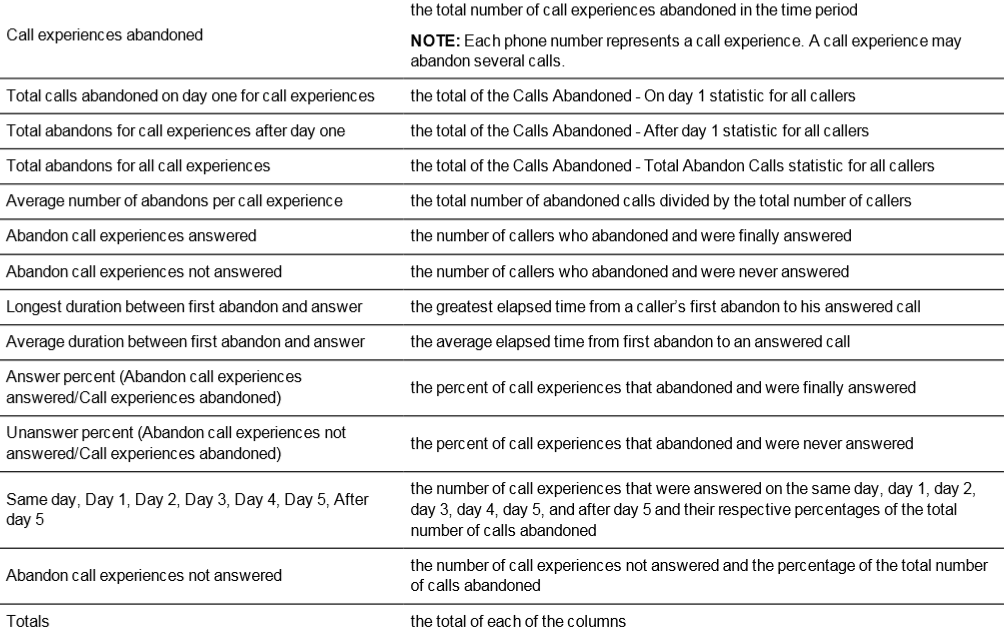
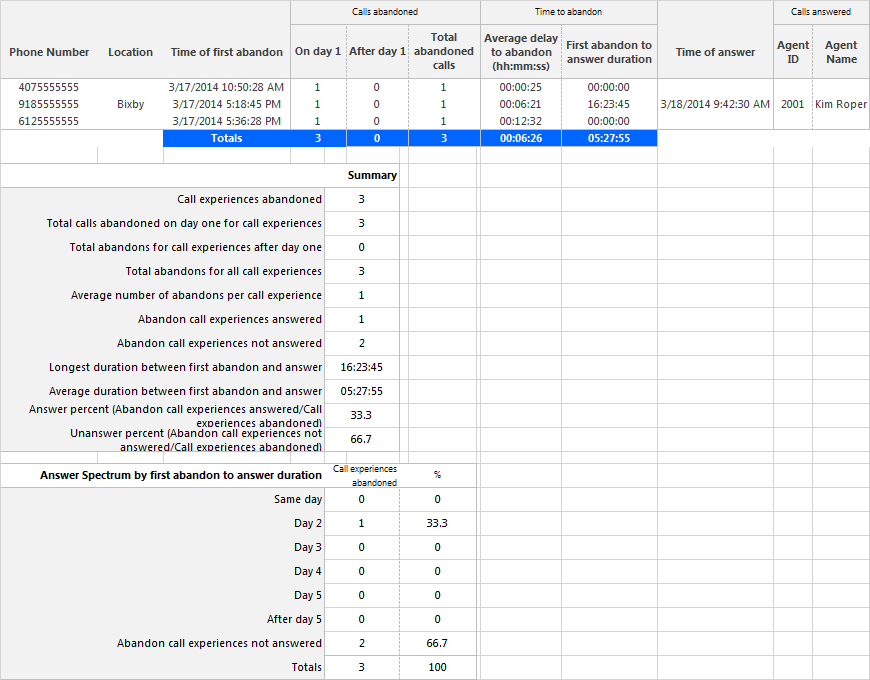
Figure 50: Voice Queue Abandon vs. Answer Comparison report
Voice Queue Group by Queue with Agent Information
The Queue Group by Queue with Agent Information report provides detailed call information for the selected queue group. (See Figure 51.)
NOTE:
- This report applies to ACD paths only. The report does not apply to Ring Group data.
- Some statistics in this report will not align because the report uses both ACD and SMDR data streams. For example, 'Average speed of answer' is derived from the SMDR data stream while 'Longest caller waiting' is derived from the ACD data stream.
The Queue Group by Queue with Agent Information report provides the following information:
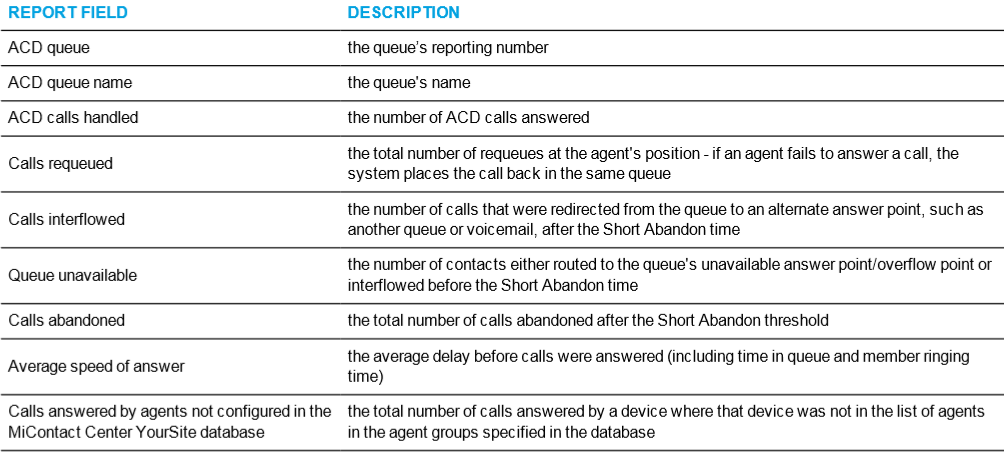
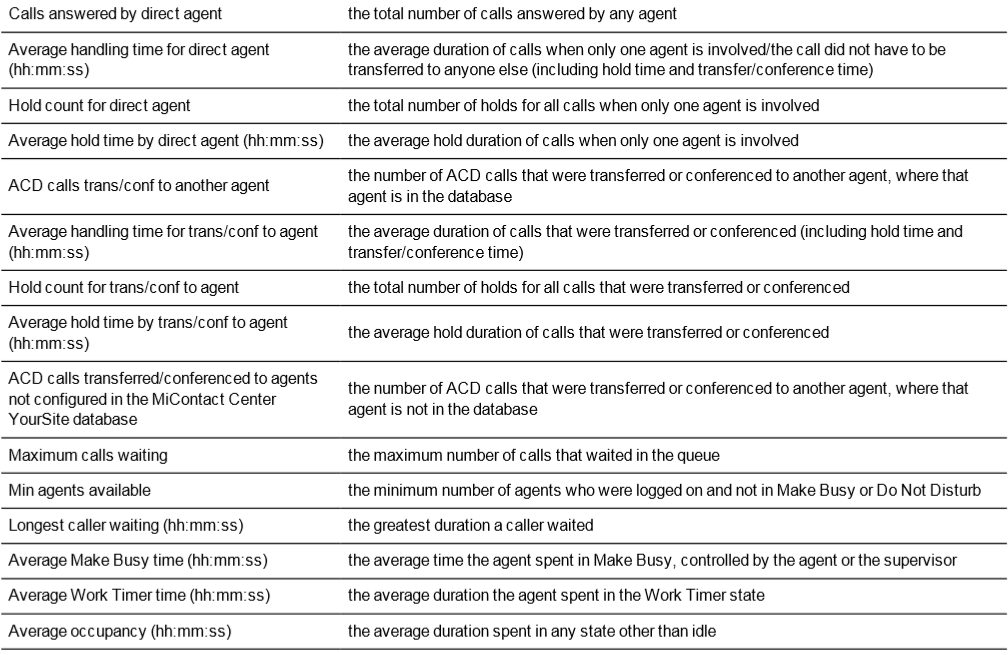

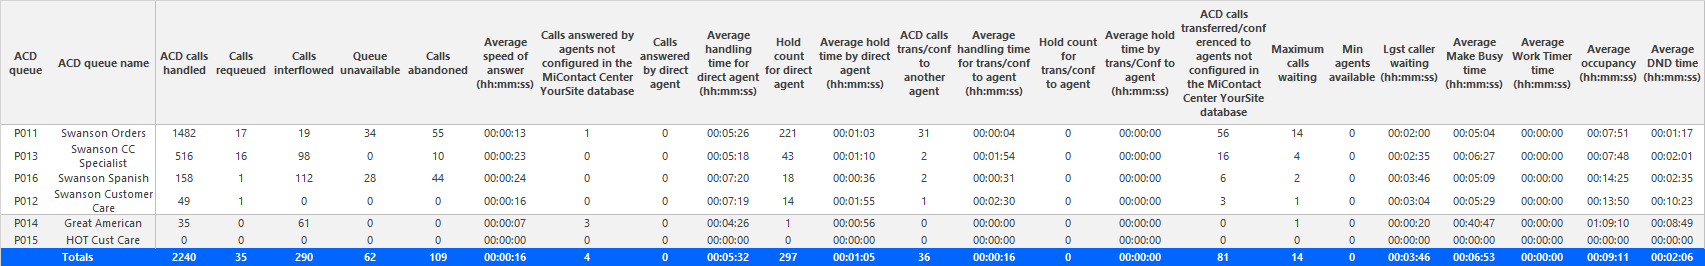
Figure 51: Voice Queue Group by Queue with Agent Information
Voice Queue and Queue Group Abandon Spectrum by Period
The Voice Queue and Queue Group Answer Spectrum by Period reports provide a frequency distribution of calls abandoned across queues and queue groups, based on a defined time scale. (See Figure 52.)
The Abandoned column contains the total number of both short and long abandoned calls.
NOTE: 'Day of week', 'Month', and 'Day of month' intervals have been added to the Spectrum by Period reports. Upgrading from Version 6.x to Version 7.x converts Spectrum by Day of Week reports into Spectrum by Period reports, with data displaying by day of week intervals.
The following are the first three fields of the Voice Queue and Queue Group Abandon Spectrum by Period reports:
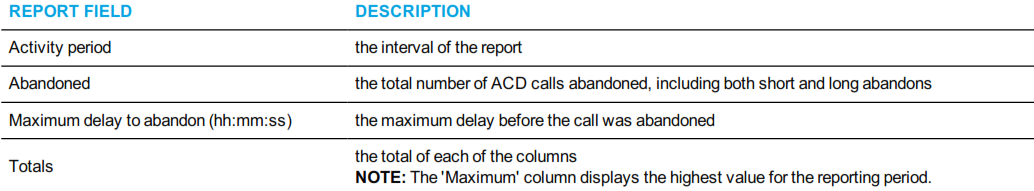
The remaining fields of the Voice Queue and Queue Group Abandon Spectrum by Period reports provide a frequency distribution of call patterns based on a defined time scale. (5, 10, 15, 20, 30, 40, 60, 80, 120, and < 120 seconds). For each time period, the Count < x sec field reflects the total number of calls for that interval and all preceding intervals. The % of Calls abandoned field reflects the percentage of calls for that interval and all preceding intervals.
NOTE:
• For each time period, except > 120 seconds, the Count < x sec field reflects the total number of calls for that interval and all preceding intervals.
• For the >120 seconds time period, the Count < x sec field reflects the total number of calls for that interval only.
• The % of field reflects the percentage of calls for that interval and all preceding intervals.
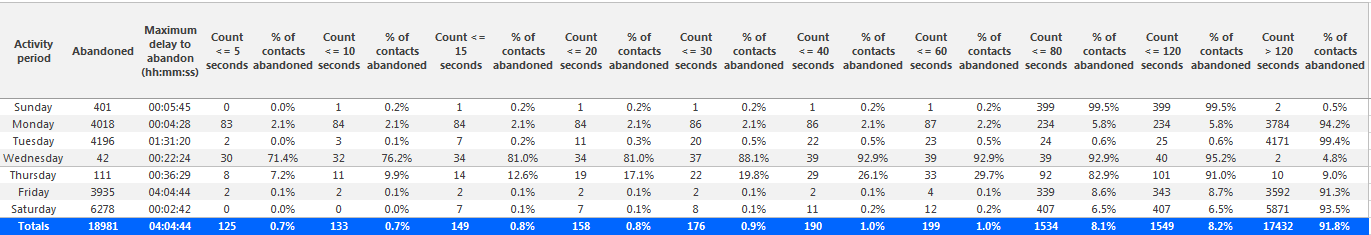
Figure 52: Voice Queue Abandon Spectrum by Period
Voice Queue Group Abandon Spectrum by Queue
NOTE: The Abandoned column contains the total number of both short and long abandoned calls.
The Queue Group Abandon Spectrum by Queue report provides a frequency distribution of call handling on a queue group across intervals from 1-10. (See Figure 53.)
The following are the first three fields of the Queue Group Abandon Spectrum by Queue report:
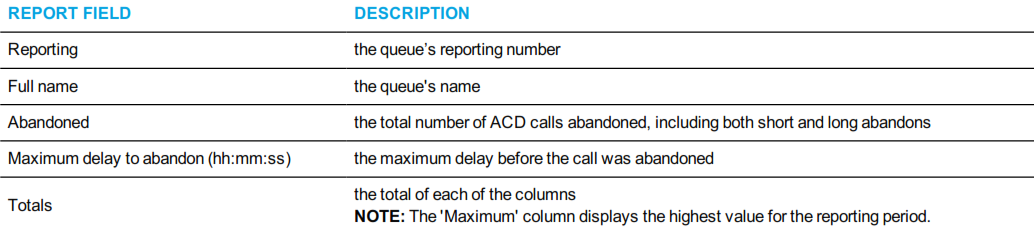
The remaining fields of the Queue Group Spectrum by Queue report provide a frequency distribution of call patterns based on a defined time scale (Spectral Interval 1-10). The Spectrum Interval field reflects the total number of calls for that interval and all preceding intervals. The % of calls abandoned field reflects the percentage of calls for that interval and all preceding intervals.
NOTE: Spectrum Interval 10 reflects the total number of calls for that interval only.
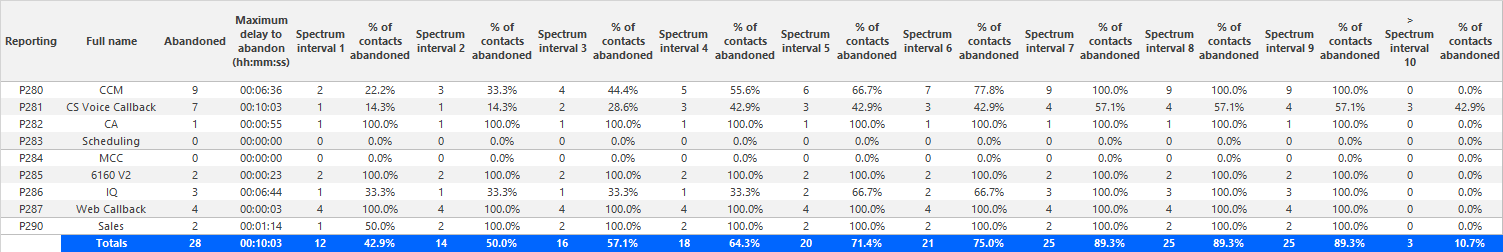
Figure 53: Voice Queue Group Abandon Spectrum by Queue
Voice Queue and Queue Group Answer Spectrum by Period
The Voice Queue and Queue Group Answer Spectrum by Period reports provide a frequency distribution of calls answered for queues and queue groups, based on a defined time scale. (See Figure 54.)
NOTE: 'Day of week', 'Month', and 'Day of month' intervals have been added to the Spectrum by Period reports. Upgrading from Version 6.x to Version 7.x converts Spectrum by Day of Week reports into Spectrum by Period reports, with data displaying by day of week intervals. The following are the first three fields of the Queue and Queue Group Answer Spectrum by Period reports:
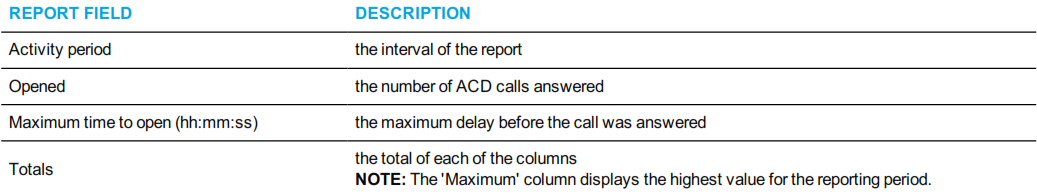
The remaining fields of the Voice Queue and Queue Group Answer Spectrum by Period reports provide a frequency distribution of call patterns based on a defined time scale. For each time period, the Count < x sec field reflects the total number of calls for that interval and all preceding intervals. The % of Calls answered field reflects the percentage of calls for that interval and all preceding intervals.
NOTE:
• For each time period, except > 120 seconds, the Count < x sec field reflects the total number of calls for that interval and all preceding intervals.
• For the >120 seconds time period, the Count < x sec field reflects the total number of calls for that interval only.
• The % of field reflects the percentage of calls for that interval and all preceding intervals.
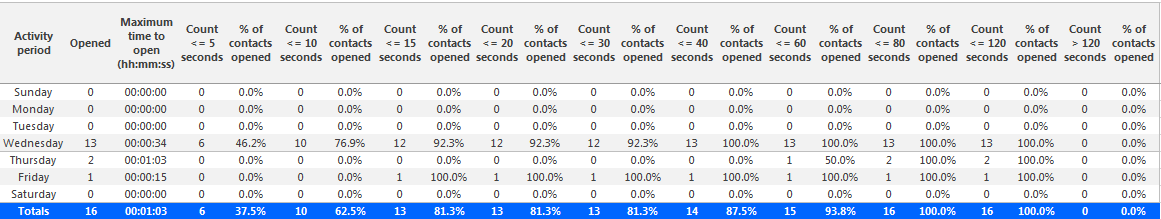
Figure 54: Voice Queue Answer Spectrum by Period
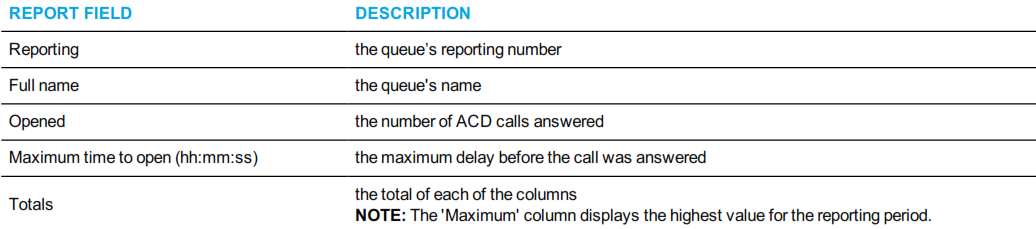
Voice Queue Group Answer Spectrum by Queue
The Queue Group Answer Spectrum by Queue report provides a frequency distribution of call handling on a queue group across intervals from 1-10. (See Figure 55.)
The following are the first four fields of the Queue Group Answer Spectrum by Queue report:
The remaining fields of the Queue and Queue Group Spectrum by Queue reports provide a frequency distribution of call patterns based on a defined time scale (Spectral Interval 1-10). The Spectrum Interval field reflects the total number of calls for that interval and all preceding intervals. The % of calls answered field reflects the percentage of calls for that interval and all preceding intervals.
NOTE: Spectrum Interval 10 reflects the total number of calls for that interval only.
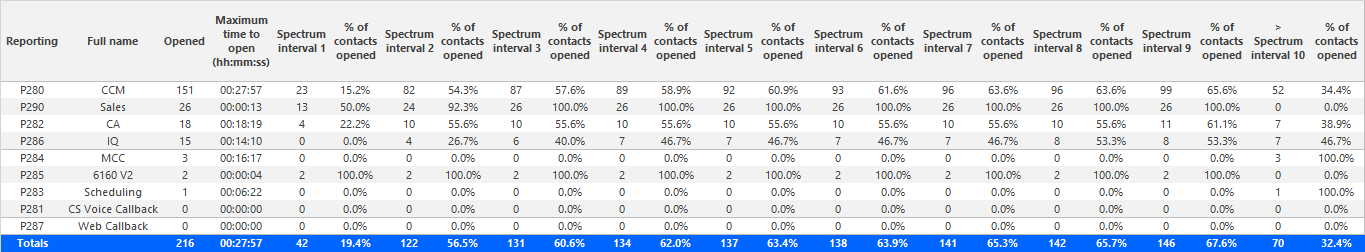
Figure 55: Voice Queue Group Answer Spectrum by Queue
Voice Queue and Queue Group Handle Spectrum by Period
The Voice Queue and Queue Group Handle Spectrum by Period reports provide a frequency distribution of calls handled for queues and queue groups, based on a defined time scale. (See Figure 56.)
NOTE: 'Day of week', 'Month', and 'Day of month' intervals have been added to the Spectrum by Period reports. Upgrading from Version 6.x to Version 7.x converts Spectrum by Day of Week reports into Spectrum by Period reports, with data displaying by day of week intervals.
The following are the first three fields of the Queue and Queue Group Handle Spectrum by Period reports:
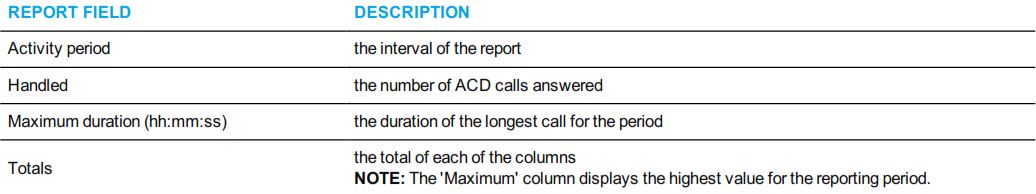
The remaining fields of the Voice Queue and Queue Group Handle Spectrum by Period reports provide a frequency distribution of call patterns based on a defined time scale (<10, <60, <180, <240, <300, <360, <420, <480, <540, and >541 seconds). For each time period, the Count < x sec field reflects the total number of calls for that interval and all preceding intervals. The % of calls handled field reflects the percentage of calls for that interval and all preceding intervals.
NOTE:
• For each time period, except > 541 seconds, the Count < x sec field reflects the total number of calls for that interval and all preceding intervals.
• For the >541 seconds time period, the Count < x sec field reflects the total number of calls for that interval only.
• The % of field reflects the percentage of calls for that interval and all preceding intervals.
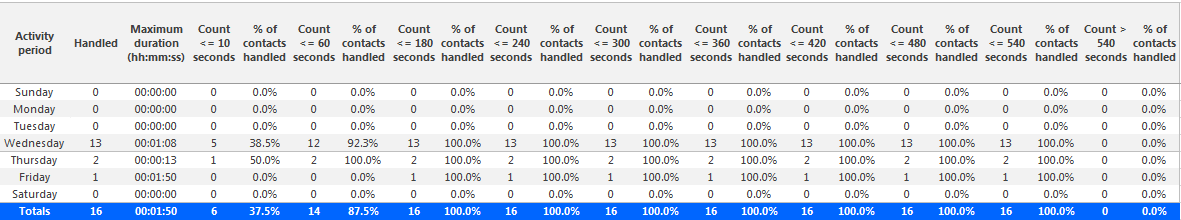
Figure 56: Voice Queue Handle Spectrum by Period
Voice Queue Group Handle Spectrum by Queue
The Queue Group Handle Spectrum by Queue report provides a frequency distribution of call handling on a queue group across intervals from 1-10. (See Figure 57.)
The following are the first four fields of the Queue Group Handle Spectrum by Queue report:
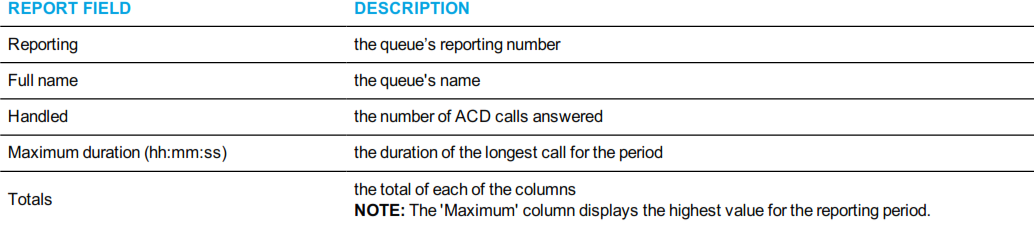
The remaining fields of the Queue and Queue Group Spectrum by Queue reports provide a frequency distribution of call patterns based on a defined time scale (Spectral Interval 1-10). The Spectrum Interval field reflects the total number of calls for that interval and all preceding intervals. The % of calls answered field reflects the percentage of calls for that interval and all preceding intervals.
NOTE: Spectrum Interval 10 reflects the total number of calls for that interval only.
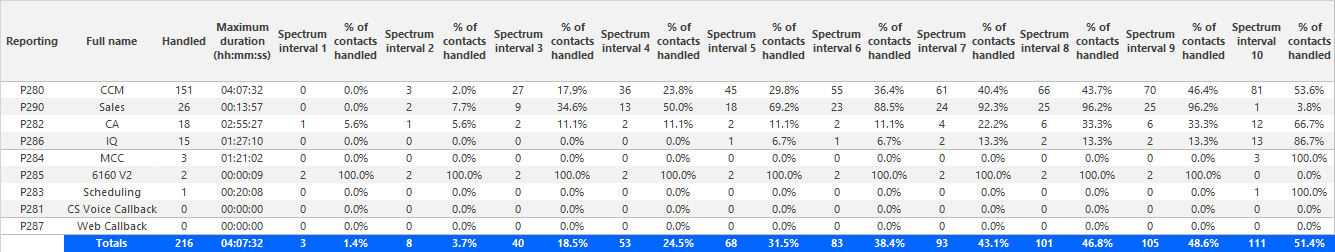
Figure 57: Voice Queue Group Handle Spectrum by Queue
Voice Queue and Queue Group lnterflow Spectrum by Period
The Voice Queue and Queue Group lnterflow Spectrum by Period reports provide a frequency distribution of calls interflowed across queues and queue groups, based on a defined time scale. (See Figure 58.)
lf your interflow statistic is zero, you probably did not program the telephone system with an interflow value.
NOTE: 'Day of week', 'Month', and 'Day of month' intervals have been added to the Spectrum by Period reports. Upgrading from Version 6.x to Version 7.x converts Spectrum by Day of Week reports into Spectrum by Period reports, with data displaying by day of week intervals.
The following are the first three fields of the Queue and Queue Group lnterflow Spectrum by Period reports:
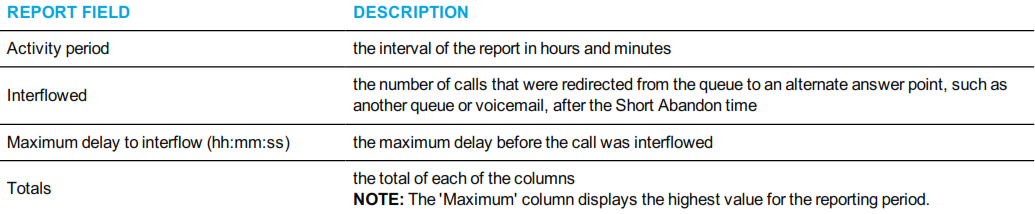
The remaining fields of the Voice Queue and Queue Group lnterflow Spectrum by Period reports provide a frequency distribution of call patterns based on a defined time scale (5, 10, 15, 20, 30, 40, 60, 80, 120, and >120 seconds). For each time period, the Count < x sec field reflects the total number of calls for that interval and all preceding intervals. The % of Calls interflowed field reflects the percentage of calls for that interval and all preceding intervals.
NOTE:
• For each time period, except > 120 seconds, the Count < x sec field reflects the total number of calls for that interval and all preceding intervals.
• For the >120 seconds time period, the Count < x sec field reflects the total number of calls for that interval only.
• The % of field reflects the percentage of calls for that interval and all preceding intervals.
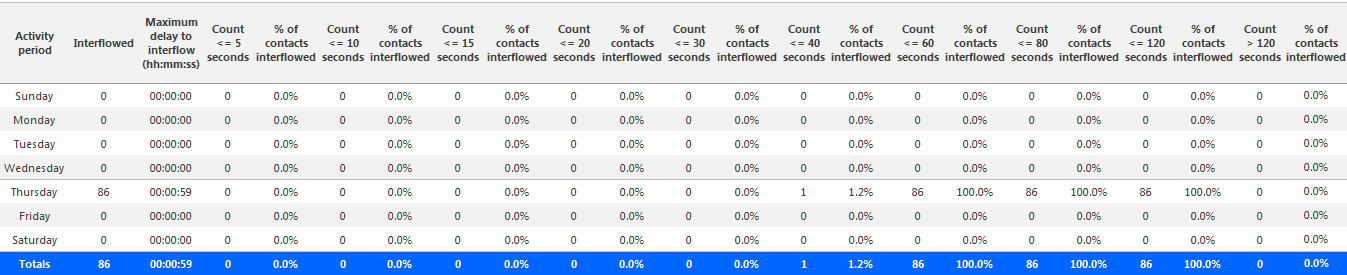
Figure 58: Voice Queue Group lnterflow Spectrum by Period
Voice Queue Group lnterflow Spectrum by Queue
The Queue Group Interflow Spectrum by Queue report provides a frequency distribution of call handling on a queue group across intervals from 1-10. (See Figure 59.
If your interflow statistic is zero, you probably did not program the telephone system with an interflow value.
The following are the first four fields of the Queue Group Interflow Spectrum by Queue report:
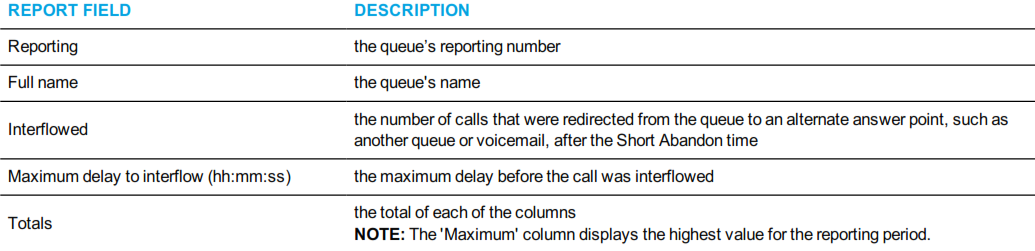
The remaining fields of the Queue Group Spectrum by Queue reports provide a frequency distribution of call patterns based on a defined time scale (Spectral Interval 1-10). The Spectrum Interval field reflects the total number of calls for that interval and all preceding intervals. The % of calls interflowed field reflects the percentage of calls for that interval and all preceding intervals.
NOTE: Spectrum Interval 10 reflects the total number of calls for that interval only.
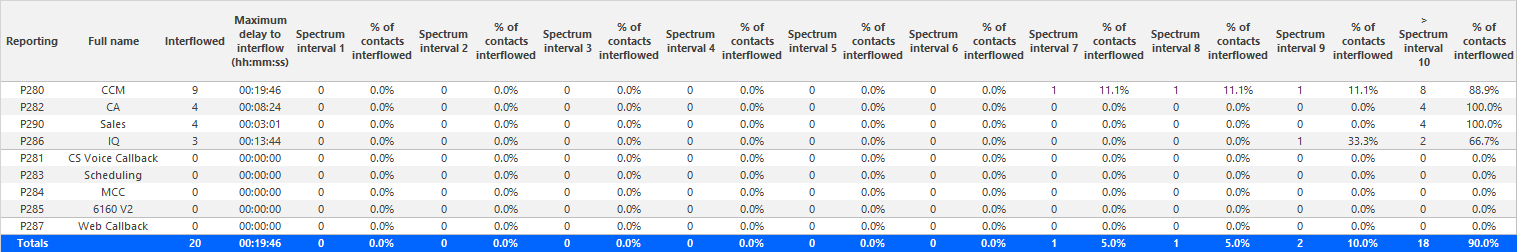
Figure 59: Voice Queue Group lnterflow Spectrum by Queue
Voice Queue Ringing Spectrum by Period and Queue Group Ring Time Spectrum by Period
The Voice Queue Ringing Spectrum by Period and Queue Group Ring Time Spectrum by Period reports provide a frequency distribution of calls ringing on the phones of queue/queue group members, based on a defined time scale (See Figure 60.)
NOTE:
• This report applies to ACD paths only. The report does not apply to Ring Group data.
• 'Day of week', 'Month', and 'Day of month' intervals have been added to the Spectrum by Period reports. Upgrading from Version 6.x to Version 7.x converts Spectrum by Day of Week reports into Spectrum by Period reports, with data displaying by day of week intervals.
The following are the first five fields of the Queue Group Ring Time Spectrum by Period report. The first three of these fields are also contained in the Queue Ringing Spectrum by Period report.
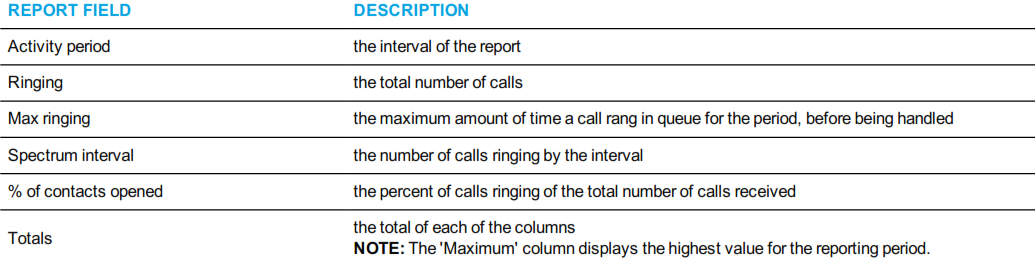
The remaining fields of the Voice Queue Ringing Spectrum by Period and Queue Group Ring Time Spectrum by Period reports provide a frequency distribution of call patterns based on a defined time scale (5, 10, 15, 20, 30, 40, 60, 80, 120, and >120 seconds). For each time period, the Count < x sec field reflects the total number of calls for that interval and all preceding intervals. The % of Calls received field reflects the percentage of calls for that interval and all preceding intervals.
NOTE:
• For each time period, except > 120 seconds, the Count < x sec field reflects the total number of calls for that interval and all preceding intervals.
• For the >120 seconds time period, the Count < x sec field reflects the total number of calls for that interval only.
• The % of field reflects the percentage of calls for that interval and all preceding intervals.
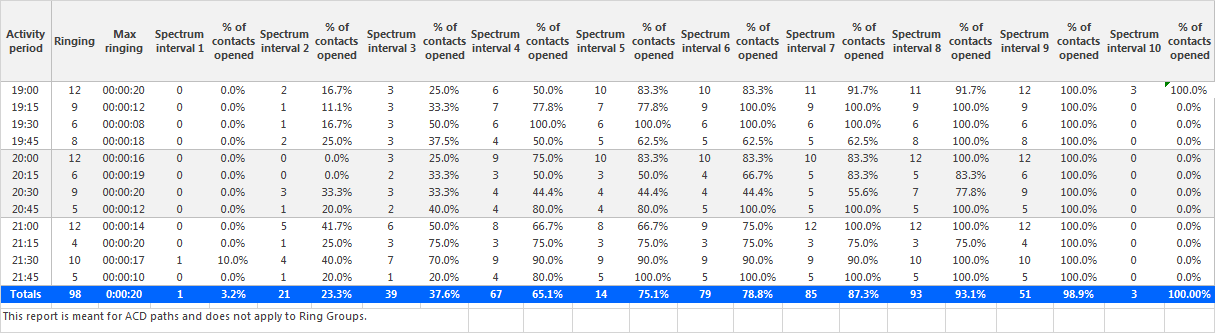
Figure 60: Voice Queue Group Ring Time Spectrum by Period
Voice Queue Group Ring Time Spectrum by Queue
The Queue Group Ring Time Spectrum by Queue report provides a frequency distribution of calls ringing on a queue group across intervals from 1- 10. (See Figure 61.)
If your ring time statistic is zero, you probably did not program the telephone system with a ring time value.
The following are the first six fields of the Queue Group Ring Time Spectrum by Queue report:
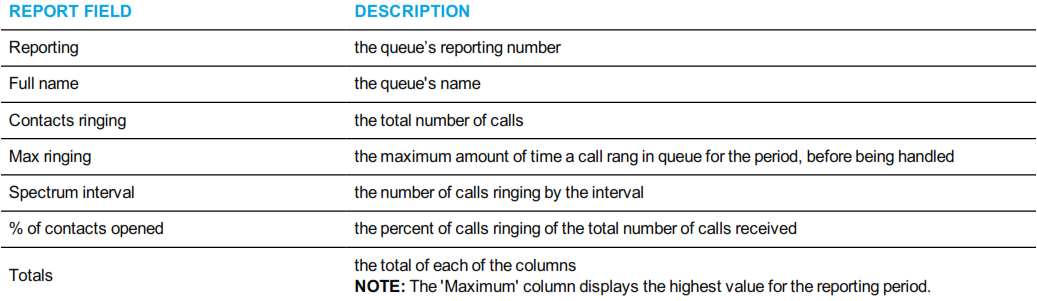
The remaining fields of the Queue Group Spectrum by Queue reports provide a frequency distribution of call patterns based on a defined time scale (Spectral Interval 1-10). The Spectrum Interval field reflects the total number of calls for that interval and all preceding intervals. The % of calls received field reflects the percentage of calls for that interval and all preceding intervals.
NOTE: Spectrum Interval 10 reflects the total number of calls for that interval only.
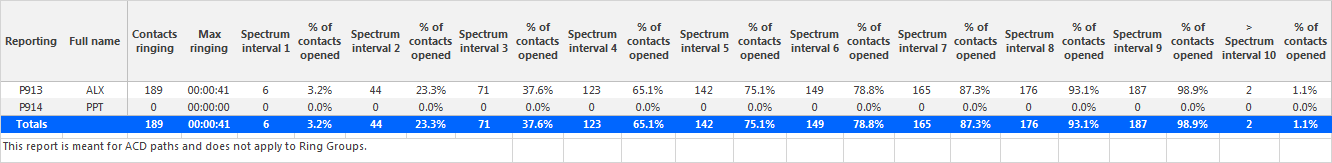
Figure 61: Voice Queue Group Ring Time Spectrum by Queue
Voice Queue and Queue Group Internal/External Call Counts by Period
The Queue and Queue Group Internal/External Call Counts by Period reports show internal and external call activity of queues and queue groups across 15-, 30-, or 60-minute intervals for the shift duration and day(s) you specify.(See Figure 62.)
If your interflow statistic is zero, you probably did not program the telephone system with an interflow value. Here is a brief definition of external and internal calls:
- Internal ACD is an ACD call that originated from inside the office to a destination within the office.
- External ACD is an ACD call that originated from outside the office with a destination within the office.
The Queue and Queue Group Internal/External Call Counts by Period reports provide the following information:
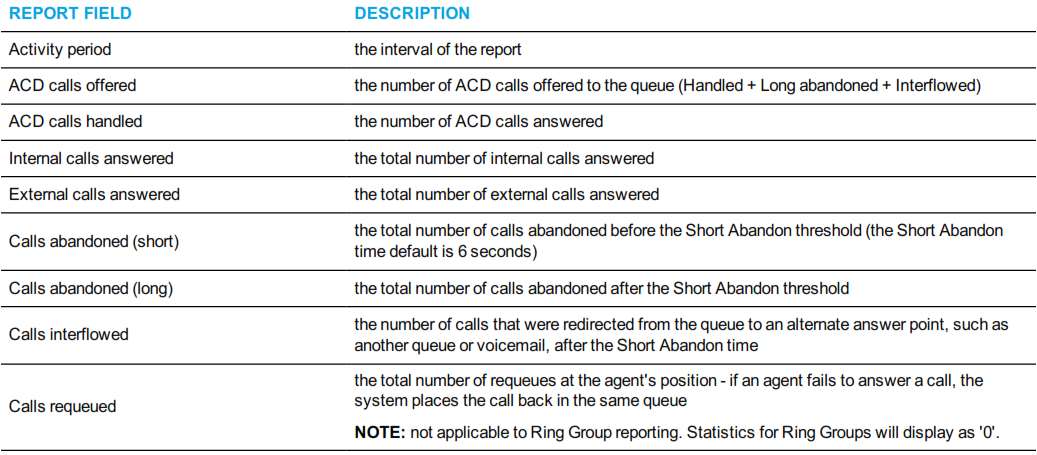
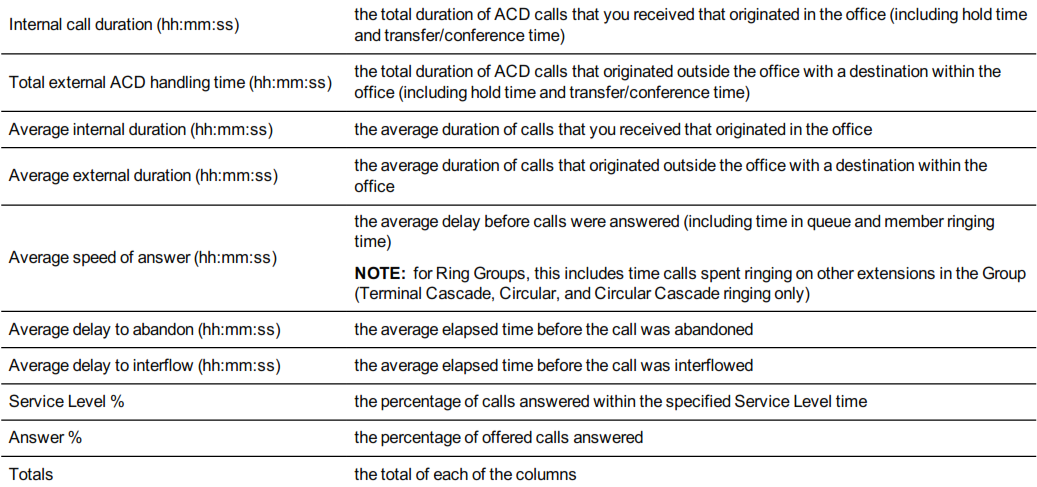
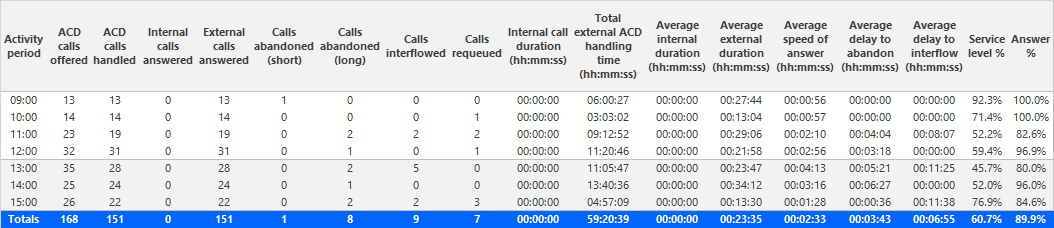
Figure 62: Voice Queue Internal/External Call Counts by Period
Voice Queue and Queue Group AN/ by Area Code
The Queue and Queue Group ANI by Area Code reports show the call distribution across area codes. (See Figure 63.)
If your interflow statistic is zero, you probably did not program the telephone system with an interflow value.
The Queue and Queue Group ANI by Area Code reports provide the following information:
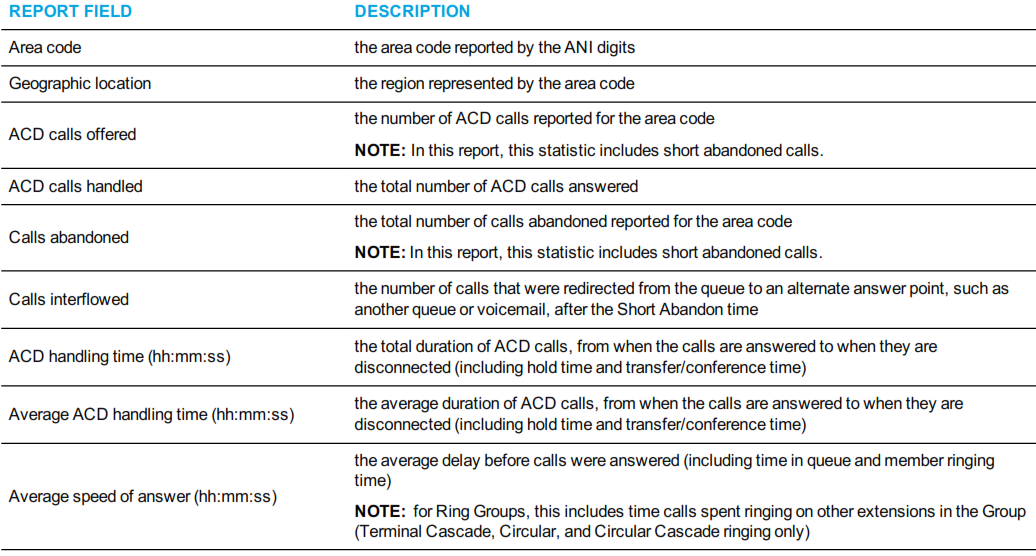

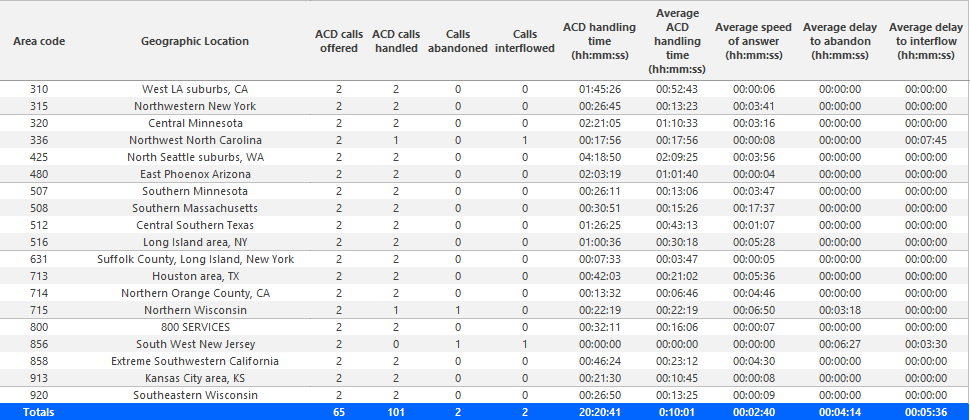
Figure 63: Voice Queue ANI by Area Code
Voice Queue and Queue Group Unavailable Trace
The Voice Queue and Queue Group Unavailable Trace reports display caller information for short and long abandoned calls. They also display caller information for calls that reached unavailable queues, including ACD paths set to Do Not Disturb. In addition, the Voice Queue and Queue Group Unavailable Trace reports sort calls based on their longest waiting time. This sorting method prioritizes customers who could be called back. You can use these reports to retrieve details on abandoned calls, calls that attempted to reach unavailable queues, and calls that may require callbacks. (See Figure 64.)
The Voice Queue and Queue Group Unavailable Trace reports provide the following information.
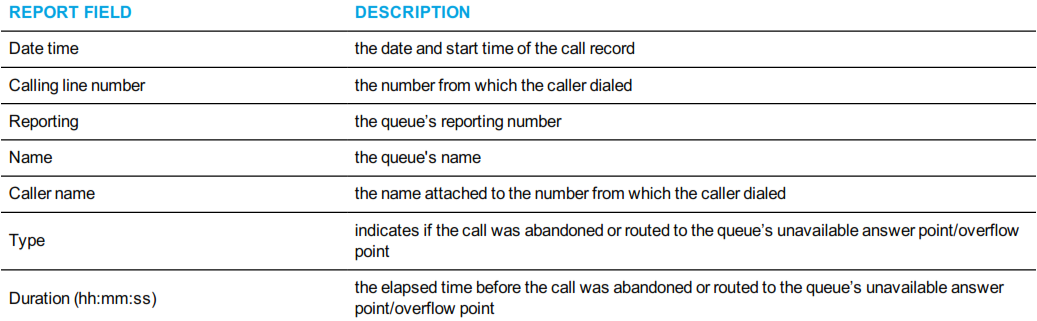
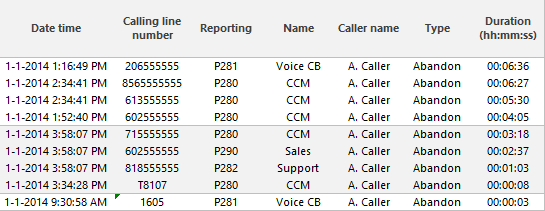
Figure 64: Voice Queue Unavailable Trace