Forecast reports use historical voice data to predict future traffic volumes, patterns, and agent requirements.
Effective contact center management involves having the right resources in place at the right times to handle an accurately forecasted workload at the desired level of service. The task of estimating resource requirements is particularly challenging as the number of calls and the total duration of calls expected for a given time interval are difficult to predict. Finding the right balance between resources and traffic volumes is critical. Forecasting accurately predicts your resource requirements.
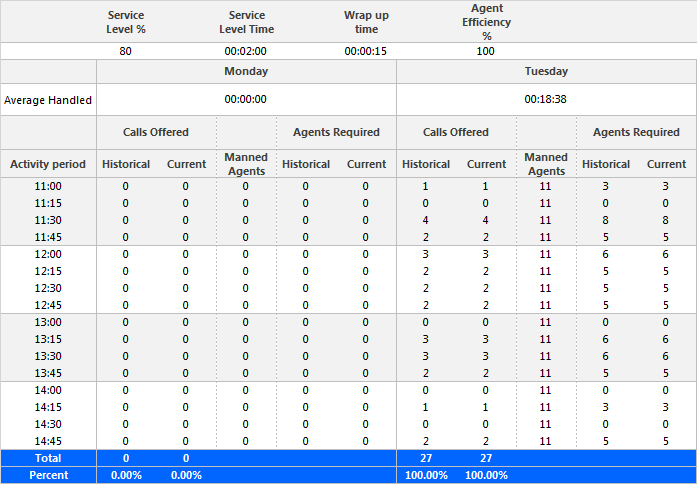
Voice Queue and Queue Group Forecasting
The Queue and Queue Group Forecasting reports use historical data to help you anticipate the number and distribution of voice agents required to meet your service level objectives. (See Figure 104.)
NOTE:- Forecasting reports must be run using historical data up to the present date. A forecasting report run for a future date will not display data. For more information, see "Forecasting"
- This report applies to ACD paths only. The report does not apply to Ring Group data.
- The Queue and Queue Group Forecasting reports provide the following information on individual agents.
| REPORT FIELD | DESCRIPTION |
|---|
| Average handled | the average length of calls during a specified day |
| Service Level % | the number of contacts sent to the queue that were answered, abandoned, or interflowed within the specified Service Level time |
| Service Level time | the threshold time used in calculating the Queue Service Objective |
| Wrap up time | the duration the agent spent in the wrap up state. Wrap up time does not include any time spent making or taking calls during the wrap up timer |
| Agent efficiency % | the percentage of time agents spend on ACD calls relative to the time agents are scheduled to work |
| Activity period | the interval of the report |
| Calls offered | the total number of calls offered to the queue (answered + long abandoned + interflowed) Manned agents the average number of agents logged on for the interval of forecasted time |
| Agents required | the number of agents required to handle the calls offered |
| Total | the total of each of the columns |
| Percent | the percentages represented by each column total, for the specific day |
Report Example