Ignite Web Live Monitoring
Ignite Web enables real-time monitoring of employees, agents, queues, and callback requests. The Ignite Web real-time monitors do not duplicate those available in Contact Center Client but, instead, offer a succinct set of the most essential statistics in the highly accessible online format of Ignite Web.
The following real-time monitors are available in Ignite Web:
- Employee State
- Agent State
- Queue Now
- Callback Requests
To access the real-time monitors in Ignite Web
- In Ignite Web, click Dashboards.
- Click the down arrow and select the dashboard from the list that contains the monitor you want to display.
NOTE:
- Alarms are not supported for real-time monitors in Ignite Web.
- Access to real-time monitors is determined by administrator-set security roles.
MONITORING EMPLOYEE STATE IN IGNITE Web
The Employee State monitor available in Ignite Web enables you to view activity and, if enabled for Interactive Contact Center, adjust presence for individual employees in your contact center.
You can view the following real-time employee information:
- Employee name, reporting number, and avatar
- ACD availability and state (with colored state icon)
- Busy duration for the day
- Do Not Disturb duration for the day
- Number of contacts handled for the day (voice, email, chat, SMS, as applicable)
- Date/Time of first login
- Total shift duration
NOTE: Only one employee at a time can display in the Employee State monitor but you can optionally add several employee monitors to a dashboard to access information for multiple employees.
The Employee State monitor in Ignite Web is accessible from your Ignite Web Dashboard.
MONITORING AGENT STATE IN IGNITE Web
The Agent State monitor available in Ignite Web enables you to view the real-time state of agents in your contact center and, if enabled for Interactive Contact Center, adjust agent presence.
Each column lists agents in order of time in state, with the longest in state at the top. For example, the agent at the top of the Idle column is the next longest idle agent and should receive the next inbound contact.
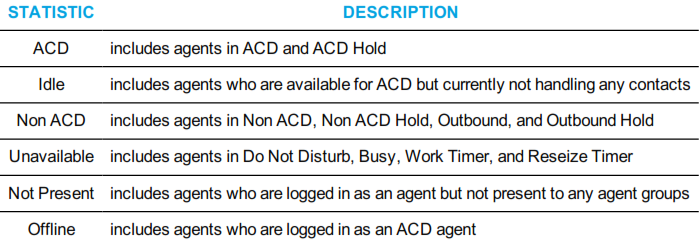
The following table lists and describes real-time agent state information that displays in the Agent State monitor in Ignite Web.
Table 16: Agent State monitor statistics - Ignite Web

The Agent State monitor in Ignite Web is accessible from your Ignite Web Dashboard.
MONITORING QUEUES IN IGNITE Web
The Queue Now monitor available in Ignite Web enables supervisors to view queue or queue group statistics and a summary of current agent states for each queue or queue group in real time.
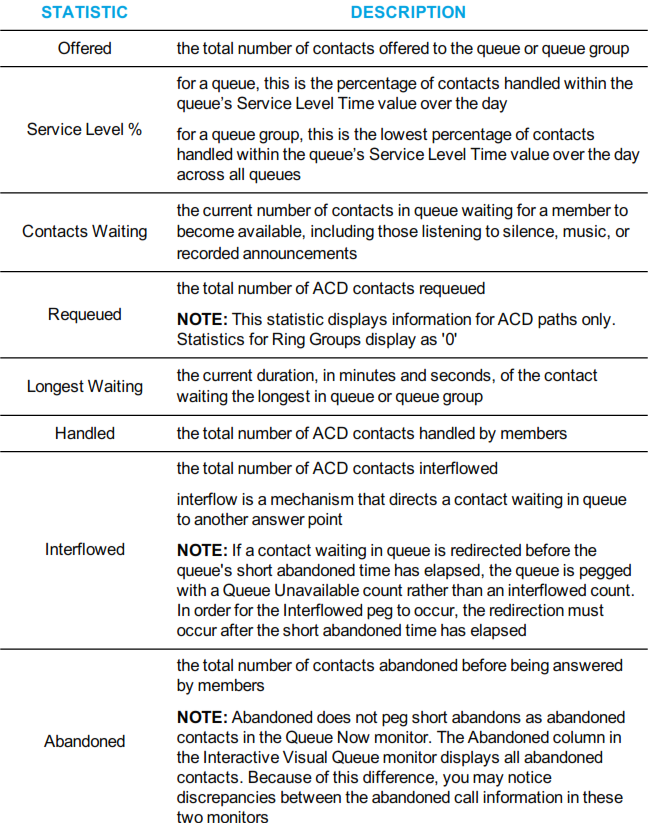
Queue statistics include Offered, Service Level %, Contacts Waiting, Requeued, and Longest Waiting. Handled, Interflowed, and Abandoned counts can also be accessed by hovering over 'Offered' for each queue or queue group.
The following table lists and describes queue statistics that display in the Queue Now monitor in Ignite Web.
Table 17: Queue Now monitor statistics • Ignite Web

The current number of agents, by state, also displays for each queue or queue group for the following agent states:
- Idle: includes agents who are available for ACD but not currently handling any contacts
- ACD: includes agents in ACD and ACD Hold
- Non-ACD: includes agents in Non ACD, Non ACD Hold, Outbound, and Outbound Hold
- Unavailable: includes agents in Do Not Disturb, Busy, and Work Timer
The Queue Now monitor in Ignite Web is accessible from your Ignite Web Dashboard.
VIEWING AND MANAGING CALLBACKS IN IGNITE Web
When licensed for IVR, the Callback Requests monitor, available in Ignite Web, enables you to interact with callbacks and monitor their state in real time.
The Callback Requests monitor enables users to requeue, reject, and delete callbacks from within the monitor. Requeued callbacks are re-entered into their queue. Rejected callbacks are removed from the queue and will not be offered to employees. Deleted callbacks are removed from the monitor, but are not removed from the system.
To requeue, reject, or delete a callback
- In the row of the call you want to interact with, in the Actions column, left-click either Requeue, Reject, or Delete.
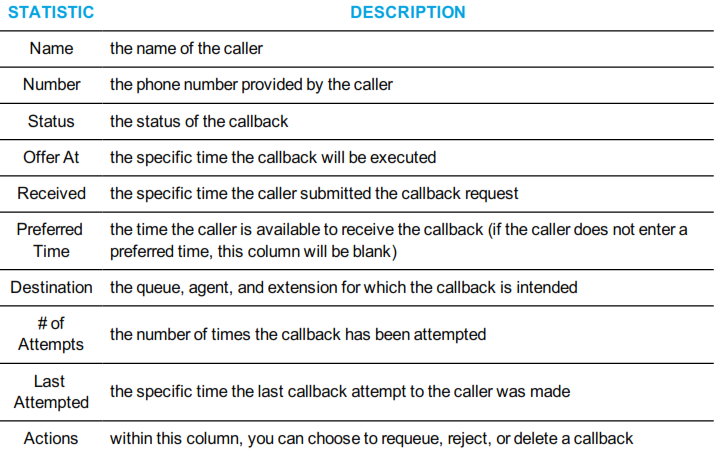
The following table lists and describes the statistics available in the Callback Requests monitor.
Table 18: Callback Requests monitor statistics - Ignite Web

The Callback Requests monitor in Ignite Web is accessible from your Ignite Web Dashboard.