FORECASTING TOOL
The Forecasting tool is accessed via Contact Center Client.
You use the Forecasting tool to create forecasts based on historical contact center traffic volumes. After loading historical data into the tool, you can perform 'what-if' scenarios and optimize the balance between the agents scheduled and your Service Level objectives.
The Forecasting tool offers a tabbed interface for viewing and setting historical data for each day of the week. If more than one media type has been included in the historical data, each day's tab will have a section for each media type included in the historic data. The forecast grid is divided into rows based on the interval time selected when loading historical data, enabling users to adjust statistics by 15, 30, or 60 minute intervals. The statistics have Historic and current values, which display the original values from the loaded historical data and the current values after user modification respectively.
After a forecast has been performed, each day lists the agents required for each interval. Figure 44 below shows the Forecasting tool.

Figure 44: Forecasting window
To forecast resource requirements you
- Load historical data.
- Modify historical data if required.
- Perform a forecast.
- Export the forecast.
To access the Forecasting tool
- Click Tools in the Contact Center Client ribbon.
- In the Data Mining section, click Forecasting.
LOADING HISTORICAL DATA
When you load historical data, you include data from a queue or queue group over a historical period that best represents the contact center activity for the time period for which you are trying to forecast. You can select one or more specific dates and/or date ranges when loading historical data. You can select sequential or non-sequential dates (for example, Monday, Wednesday, and Friday) to use in the forecast. You can also exclude specific dates from within your date range.
NOTE:
- Users should identify and exclude any outliers or extreme values from the time period from which they are loading historical data, as these may give artificial values.
- Historical data for agents can be validated by comparing it to the queue and queue group by period reports for the same periods.
- Ring Groups are not supported with Forecasting, either as queues or as a member of a reporting queue groups.
The following procedure takes place in an open Forecasting tool window.
To load historical data
- Click Load historical data. The Forecasting window opens.
Under Queues or Queue groups, click on the queue or queue groups you want to use as the source of historical data.

NOTE:
You can load historical data for a queue or queue group. If you are using the forecast to build a schedule, select historical data from the same queue group with which the schedule is associated. This data will best represent the agents required for your schedule.- If you want to include or exclude data from a specific date, under Historical date(s) for the forecast, select Specific day and then select a date.
- If you want to include or exclude data from a date range, click Date range and specify a range of dates.
- If you are including the data from the specified date(s), click Include dates.
- If you are excluding the data from the specified date(s), click Exclude dates.
- Repeat steps 3-6 until you have specified the date(s) or date range(s) from which you will derive your historical data.
- After Start hour and End hour, select the time frame for historical data.
- After Interval, select the schedule interval: 15, 30, or 60 minutes. The Interval value, in minutes, is the time increment by which the forecast will be displayed. It is recommended that you select an interval that matches the increments in which you schedule your employees. For example, if you schedule your employee shifts in 30 minute increments, select 30 minutes as the Interval value.
- Click Submit.
MODIFYING HISTORICAL DATA
After loading your historical data, you can modify the values of Contacts Offered and Average Handle Time to generate different forecast results based on the modified values. You can also modify values after performing forecasts to obtain different forecasts of required agents. The historical values for data are always displayed, regardless of modifications, for comparison.
Modifying Average Handle Time
You can modify the Average Handle Time value for an interval, a day, or several days simultaneously. When you select a modification to apply to a value, either the Historic or Current value, it is applied as the new Current value. You cannot change the Daily Average Handle Time, but you can use it to modify the Average Handle Time of other intervals.
The following procedures outline how to
- Modify the Average Handle Time parameter on the forecast grid
- Modify an interval's Average Handle Time parameter
- Modify the Average Handle Time parameter using the Historic Daily Average Handle Time parameter
The following procedures take place in an active Forecasting tool window.
To modify the Average Handle Time parameter on the forecast grid
- Click Modify...=>Average Handle Time. Alternatively, select an interval row, click the cell for Current Average Handle Time, and click the … button. See Figure 45.
- Under Specify the Average Handle Time value(s), specify how you want to modify Average Handle Time:
- Increase or decrease Average Handle Time by a specific number of seconds
- Increase or decrease Average Handle Time by a specific percentage
- Set the Average Handle Time to a specific number of seconds
- Under Apply the changes to the following data source, specify if you want to have the modification applied to the original value or the current grid value.
- Under Apply to days, select the days for which you want to modify Average Handle Time.
- Under Apply to media type, select the media types for which you want to modify Average Handle Time.
- Click Apply.
To modify an interval's Average Handle Time parameter
- Select an interval row, click the cell for Current Average Handle Time.
- Set the Average Handle Time parameter for the interval.
To modify the Average Handle Time parameter using the Historic Daily Average Handle Time parameter
- Click the … button after Historic Daily Average Handle Time.
- Under Specify the Average Handle Time value(s), specify how you want to modify the Historic Daily Average Handle Time:
- Increase or decrease Average Handle Time by a specific number of seconds
- Increase or decrease Average Handle Time by a specific percentage
- Set the Average Handle Time to a specific number of seconds
3. Under Apply to days, select the interval(s) for which you want to apply the modified Historic Daily Average Handle Time.
4. Click Apply.
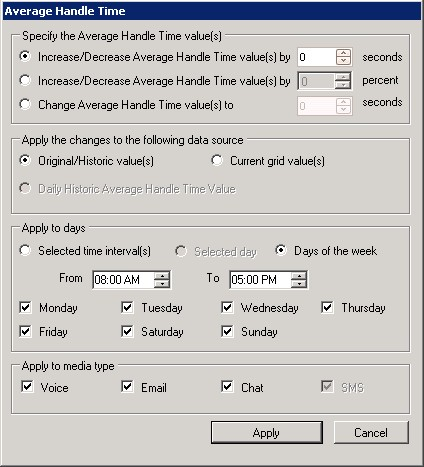
Figure 45: Average Handle Time window
Modifying Contacts Offered
You can modify the Contacts Offered value for one or several time intervals simultaneously. When you select to modify a value, either Historic or Current, it is applied as the new Current value.
This section explains how to:
- Modify the Contacts Offered parameter on the forecast grid
- Modify an interval's Contact Offered parameter
The following procedures take place in an active Forecasting tool window.
To modify the Contacts Offered parameter on the forecast grid
- Click Modify...=>Contacts Offered. See Figure 46.
- Under Specify how you want to change the Contacts Offered value(s), specify how you want to modify Contacts Offered:
- Increase or decrease Contacts Offered by a specific number of calls
- Increase or decrease Contacts Offered by a specific percentage
- Set the Contacts Offered to a specific number of call
- Under Apply the changes to the following data source, specify if you want to modify the original value or the current grid value.
- Under Apply to times, select the days and time interval for which you want to modify Contacts Offered.
- Under Apply to media type, select the media types for which you want to modify Contacts Offered.
- Click Apply.
To modify an interval's Contacts Offered parameter
- Select an interval row, click the cell for Current Contacts Offered.
- Set the Current Contacts parameter for the interval.
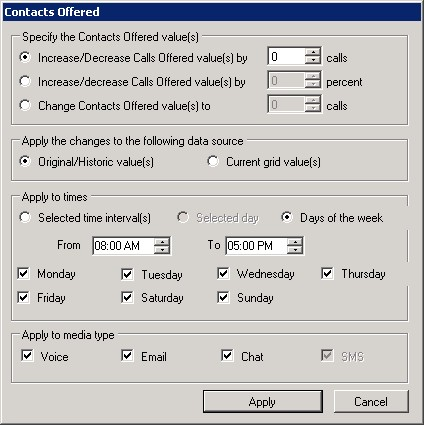
Figure 46: Contacts Offered window
Modifying the weekly total for Contacts Offered
You can modify the Contacts Offered values for an entire week simultaneously. Modifying these values changes the number of Contacts Offered while maintaining the same proportion of calls across all time intervals. For example, if you increase the weekly total by 10 percent, an interval with 10 calls will change to 11. However, an interval with zero calls will remain zero.
The following procedure takes place in an active Forecasting tool window.
To modify the Contacts Offered parameter on the forecast grid
- Click Modify...=>Weekly total. See Figure 47.
- Under Specify how you want to change the weekly total, specify how you want to modify Contacts Offered over the week:
- Increase or decrease the weekly total of Contacts Offered by a specific number of contacts
- Set the weekly total of Contacts Offered to a specific number of contacts
- Under Apply to totals, specify if you want to modify the original values or the current grid values.
- Click Apply.
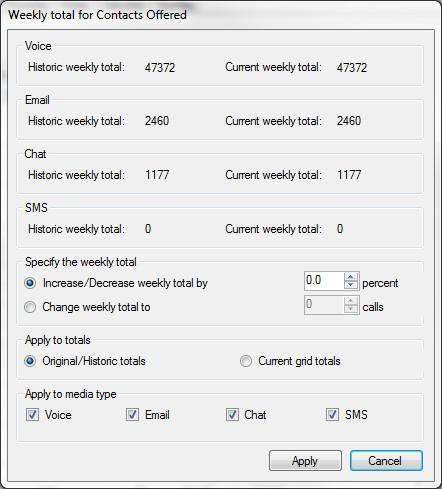
Figure 47: Weekly total for Contacts Offered window
PERFORMING FORECASTS
When you perform a forecast, you receive the required agents based on both the historical and current values. If you adjust any of the values in your historical data, you must perform the forecast again.
NOTE: It is recommended that you save your forecast as an Excel file to preserve your settings to use or compare with the next forecast you make.
To run a forecast
- Specify the Service Level %, Service Level Time, Wrap Up Time, and Agent Efficiency % you expect for the queue or queue group.
- Click Perform forecast.
You can perform what-if scenarios on the historical data using different Service objectives statistics until you are satisfied with the forecast.
EXPORTING FORECASTS
After performing a forecast, you can export it as a Microsoft Excel spreadsheet or export the forecast to Workforce Scheduling.
Saving forecasts as Excel files
After you generate forecast data you can export it to a Microsoft Excel .xlsx worksheet. If your forecast has different media types, each media type will have its own worksheet in the .xlsx file.
To export a forecast as an Excel file
- Click Export Forecast.
- Click Microsoft Excel.
- Click Export.
The forecast opens in a Microsoft Excel spreadsheet you can modify and save.