Contact Center Client
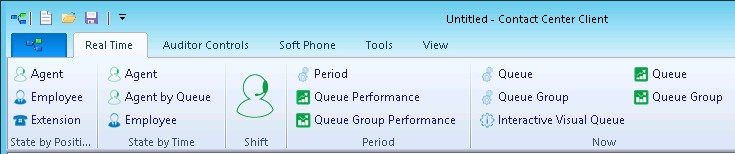
Figure 9: Contact Center Client ribbon
Some tabs that display in the ribbon are dependent upon which monitor is active. These are referred to as context sensitive tabs. When you enable context sensitivity for monitors, the associated context sensitive tab for the active monitor automatically becomes the active tab. See Table 1 for a list of the associated context sensitive tabs for each monitor. See Figure 10 for an example of context sensitivity enabled for the Agent State by Position monitor. Note that the Agent and Monitor Control tabs display in the ribbon.
NOTE: The options that display in the Contact Center Client ribbon are dependent upon your individual security settings. Options which you are not given access to will not display.
Table 1: Context sensitivity options display per monitor
| MONITOR | ASSOCIATED CONTEXT SENSITIVE TABS |
|---|---|
| Agent State by Position | Agent and Monitor Control tabs |
| Employee State by Position | Employee and Monitor Control tabs |
| Extension State by Position | Extension and Monitor Control tabs NOTE: When an agent is logged into an extension, the context sensitivity tab displays 'Agent Control'. When no agent is logged into the extension, the context sensitivity tab displays 'Extension Control'. |
| Extension Now | Monitor Options tab |
| Agent State by Time | Agent and Monitor Control tabs |
| Agent State by Time for Queue | Agent and Monitor Control tabs |
| Employee State by Time | Employee and Monitor Control tabs |
| Agent Shift | Agent and Monitor Control tabs |
| Queue by Period | Monitor Options tab |
| Queue Now | Monitor Options tab |
| Queue Group Now | Monitor Options tab |
| Queue Performance | Chart Options tab |
| Queue Group Performance | Chart Options tab |
| Queue | Chart Options tab |
| Queue Group | Chart Options tab |
| Interactive Visual Queue | n/a NOTE: Context sensitivity is not supported for the Interactive Visual Queue monitor |
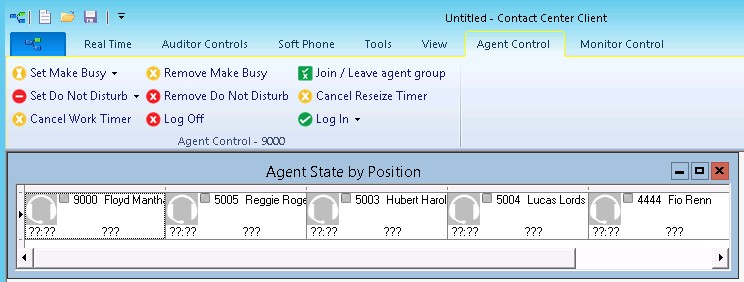
Figure 10: Context sensitivity example • Agent Control tab
STARTING CONTACT CENTER CLIENT
You start Contact Center Client to access real-time functionality. Supervisors and agents can view real-time voice statistics. In contact centers that have the optional Multimedia Contact Center application, supervisors and agents can view real-time voice, email, chat, and SMS statistics. After starting Contact Center Client, you can choose to minimize it to either the system tray or the taskbar, depending on your operating system.
NOTE: Launching client-side desktop applications from the task bar causes them to bypass the MiContact Center Updater Service process. To ensure successful updates from the Enterprise Server, after an upgrade close all client-side applications for 15 minutes or reopen them from the Start menu/Start screen.
To start Contact Center Client
- Open Contact Center Client.
- If prompted, type your Username and Password and verify the Enterprise Server IP
- address.
- If you use Secure Socket Layer, select SSL.
- Optionally, select Remember my credentials.
- Click Login.
To display Contact Center Client in the taskbar
- In Contact Center Client, click the File tab.
- Click Options.
- Clear the Hide when minimized check box and click OK.
Contact Center Client, when minimized, will display in the taskbar. - To save the profile, click File=>Save as.
- Type a Name for the profile and click OK.
The profile is saved and will automatically be applied each time you open Contact Center Client.
When your System Administrator changes device settings (such as changes to naming or associations between devices), they will be automatically reflected in your Contact Center Client user profile.
CONFIGURING CONTACT CENTER CLIENT OPTIONS
You can customize the Contact Center Client user interface and real-time monitor device control and display options by accessing the Options menu.
To configure Contact Center Client options
- In the ribbon, click the File tab.
- Click Options.
The Options window displays. See Figure 11. - Under User interface display, select a Toolbar style, Real-time icon type, Background color, Page size, and whether you want to hide Contact Center Client when the window is minimized.
- Select Context Sensitivity for Monitors if you want the context sensitive tab to automatically become the active tab when you select a monitor.
NOTE: Monitor context sensitivity is enabled by default. - Select Context Sensitivity for Soft phone if you want the soft phone tab to automatically become the active tab when a call is received. If the Soft phone toolbar is floating, context sensitivity does not apply. Soft phone context sensitivity is disabled by default.
- Select the Display monitor device control option check box if you want to be able to see the option for monitor control when you right-click cells in a real-time monitor.
NOTE: Monitor control enables you to simultaneously control all of the agents on a monitor and is only available if you have appropriate permissions. - Configure Time format options. The options you select will display in the real-time monitor cells.
- Under Full name format, select how you want agent and employee first and last names to display in real-time monitors.
- Click OK.
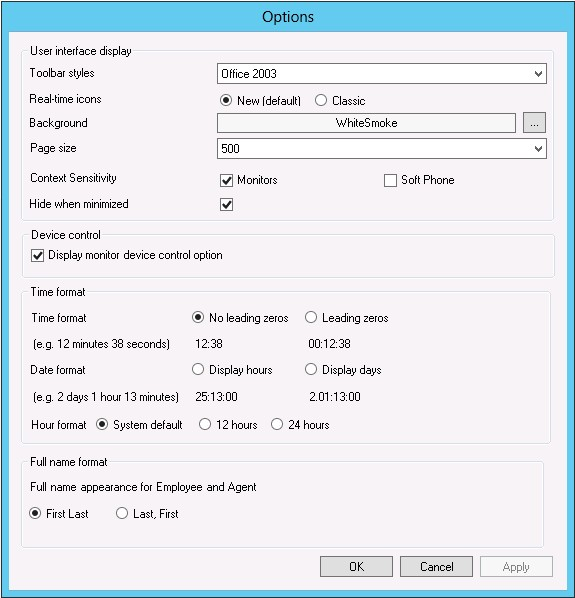
Figure 11: Contact Center Client option
ADJUSTING THE CONTACT CENTER CLIENT VIEW
You can adjust the way you view Contact Center Client features on your desktop. To adjust the view
- Click View in the Contact Center Client ribbon.
The View options ribbon opens. See Figure 12.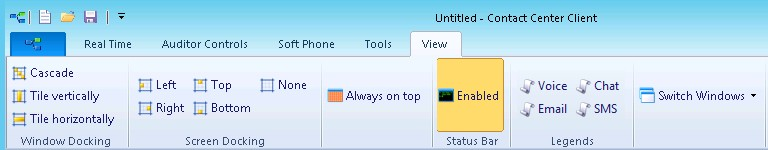
Figure 12: View options ribbon
2. To change the way monitors display inside Contact Center Client, select from the options in the Window Docking column.
3. To adjust the position of the Contact Center Client window on your desktop, select from the options in the Screen Docking column.
4. If you want Contact Center Client to always display on top of other applications on your desktop, click Always on top.
5. Enable the Status Bar if you want the status bar to be visible at the bottom of the Contact
Center Client window. See Figure 13. 
Figure 13: Status bar
6. To open Voice, Email, Chat, or SMS legends, select from the options in the Legends column.
EMPLOYEE AND AGENT STATES
NOTE:
- If Contact Center Client becomes disconnected from the server, upon re-connection the following states will automatically be synchronized with the server.
Table 2 lists the employee states and their corresponding icons. Table 3 lists the agent states and their corresponding icons.
Table 2: Employee states
| TERM | ICON | MEANING |
|---|---|---|
| Ringing |
| An ACD contact ringing on the employee, waiting to be handled |
| ACD |
| An employee handling an ACD contact |
| ACD Hold |
| An employee who has placed an ACD contact on hold |
| Idle |
| An employee logged on and waiting to receive a contact |
| Non ACD |
| An employee involved in an incoming non-ACD contact or employee-originated voice contact |
| Non ACD Hold |
| An employee who has placed a non-ACD voice contact on hold |
| Outbound |
| An employee on an outgoing voice contact |
| Outbound Hold |
| An employee who has placed an outgoing voice contact on hold |
| Do Not Disturb |
| An employee who has activated Do Not Disturb and is not available to receive any ACD or non-ACD contacts |
Make Busy |
| An employee who is not available to receive ACD contacts but can receive transferred contacts and voice contacts dialed directly to the employee. This icon also displays when an employee's external hot desk agent is in the Reseize Timer state |
Table 2: Continued
| TERM | ICON | MEANING |
|---|---|---|
| System Make Busy |
| If an employee has multimedia agent IDs and is logged on to two or more media servers simultaneously, the system sends the agent only one incoming communication at a time. For example, when the agent answers a voice contact, the system places the agent ID(s) for the other media server types in System Make Busy |
| Work Timer |
| An employee who is completing post-contact work, such as paperwork, and is unavailable to receive contacts of that media type |
| Logged Off |
| An employee not currently logged in to any queue |
Logged In Not Present Unavailable |
| An employee logged in but not present to any of their agent groups, and employees not present to a media type across all groups. An employee who has not generated any activity since MiContact Center was started |


Table 3: Agent States
| TERM | VOICE | CHAT | SMS | MEANING | |
|---|---|---|---|---|---|
| Ringing |
|
|
|
| An ACD contact ringing on an agent, waiting to be handled |
| ACD |
|
|
|
| An agent handling an ACD contact |
| ACD Hold |
|
|
|
| An agent who has placed an ACD contact on hold |
| Idle |
|
|
|
| An agent logged on and waiting to receive a contact |
| Non ACD |
| n/a | n/a | n/a | An agent involved in an incoming non-ACD contact or agent-originated voice contact |
| Non ACD Hold |
| n/a | n/a | n/a | An agent who has placed a non- ACD voice contact on hold |
| Outbound |
| n/a | n/a | n/a | An agent on an outgoing voice contact |
| Outbound Hold |
| n/a | n/a | n/a | An agent who has placed an outgoing voice contact on hold |
| Do Not Disturb |
|
|
|
| An agent who has activated Do Not Disturb and is not available to receive any ACD or non-ACD voice contacts |
| Make Busy |
|
|
|
| An agent who is not available to receive ACD contacts but can receive transferred contacts and voice contacts dialed directly to the agent. This icon also displays when an external hot desk agent is in the Reseize Timer state |
| System Make Busy |
|
|
|
| If an agent is a multimedia agent and is logged on to two or more media servers simultaneously, the system sends the agent only one incoming communication at a time. For example, when the agent answers a voice contact, the system places the agent ID(s) for the other media server types in System Make Busy |
| Work Timer |
|
|
|
| An agent who is completing post- contact work, such as paperwork, and is unavailable to receive contacts of that media type |
| Unknown |
|
|
|
| An agent who has not generated any activity since MiContact Center was started |
| Logged Off |
|
|
|
| Logged Off An agent not currently logged in to any queue |
| Logged In Not Present |
|
|
|
| An agent logged in but not present to any of their agent groups, and agents not present to a media type across all groups |


EXTENSION STATES
NOTE:
- If your Contact Center Client becomes disconnected from the server, upon re-connection the extension states will automatically by synchronized with the server.
- If an agent is logged into the extension, agent state icons will display.
- Table 4 lists the extension states and their corresponding icons.
Table 4: Extension states
| TERM | ICON | MEANING |
|---|---|---|
| Ringing |
| Call is ringing on the extension and waiting to be handled |
| ACD |
| Extension is involved in an ACD call |
| ACD Hold |
| Extension has placed an ACD call on hold |
| Idle |
| Extension is waiting to receive a call |
| Non ACD |
| Extension is involved in an incoming call or an internal extension- originated call |
| Non ACD Hold |
| Extension has placed an incoming call or an internal extension- originated call on hold |
| Outbound Call |
| Extension is on an outgoing call |
| Outbound Hold |
| Extension has placed an outgoing call on hold |
| Forwarded to |
| Extension has set all incoming calls to be forwarded to an alternate answer point |
Camp on Extension |
| is on a call and an incoming call is camped on (waiting to be answered) |
| Off Hook |
| Extension's phone is off the hook, so cannot receive calls |
| Do Not Disturb |
| Extension has activated Do Not Disturb and is not available to receive calls |
| Logged Off |
| Extension is not currently logged on and is unavailable to take calls |
| Logged In Not Present |
| Extension is removed from its Ring Groups |
| Unknown |
| Extension has not generated any activity since MiContact Center was started |


UNDERSTANDING CONTACT CENTER CLIENT FEATURES
Contact Center Client has agent, queue, queue chart, and call note monitors.
You can perform the following tasks on the monitors by either right-clicking within the monitor or selecting options via the Contact Center Client ribbon:
- Call recording
- Open monitors
- Dock monitors
- Add and remove device IDs
- Sort monitor devices
- Rearrange cells
- Set monitor dimensions
- Freeze and unfreeze columns
- Hide and show columns
- Filter device variables
- Set alarms
- Clear alarms
- Define monitor styles
- Group data
- Print monitors
- Arrange windows
- Modify the view
- Build marquee monitors to broadcast statistics and messages
- Chat online with other employees
Contact Center Client options
The following options apply to real-time monitors.
Call recording
On the Agent State by Time, Agent State by Position, Agent State by Queue by Time, and Extension by Position monitors, the Call recording option enables you to start, stop, and restart call recording at any time during a call.
Clear alarms
The Clear alarms command clears any current performance variable threshold alarms.
Set alarms
The Set alarms command specifies performance thresholds for queues, extensions, and agents.
Add/Remove devices
The Add/Remove devices command adds or removes devices or device groups from the monitor. If you add agents, they are added to the bottom of the monitor.
Set table dimensions
On the Agent State by Position, Extension State by Position, and Employee State by Position monitors, the Set table dimensions command adds or deletes columns or rows. If you delete devices, they are deleted them from the lower-right side of the monitor.
Size table to frame
On all monitors, the Size table to frame command adjusts the table to fit within the frame
Sort monitor
On the Agent State by Position, Extension State by Position, and Employee State by Position monitors, the Sort monitor by Agent ID, name, state, or extension command sorts agents by Agent ID, name, state and time in state, or extension. Note that you cannot drag and drop devices between monitors.
Filter device variables
On the Extension Now, Agent Shift, Queue by Period, and Queue Now monitors the Filter device variables command filters the data based on conditions you specify and displays a subset of data on the monitor.
General
On all monitors, under Properties, the General option specifies the monitor name and enables the horizontal and vertical scroll bars.
On the queue monitors, you can also enable grouping.
On the extension, agent, and employee monitors you can also display tool tips, display a pattern upon failover, and display instant messaging online presence indicators.
On the Agent and Employee State by Time monitors, you can also sort logged off agents by the longest logged off first.
Print monitor
The Print monitor command prints the current monitor.
Enable grouping
Under Properties, the Enable grouping option displays a grouping panel to which users can drag columns. The grouping order determines the order in which the rows display. The Enable grouping option affects all monitors that contain columns.
Row settings
Under Properties=>Layout, the Row settings option specifies the background color and font color of rows, and the font type and text alignment.
Row alternate settings
Under Properties=>Layout, the Row alternate settings option specifies the background color and font color of alternate rows, and the font type and text alignment.
Column settings
Under Properties=>Layout, the Column settings option specifies the background color and font color of columns, and the font type and text alignment.
Column dimensions
Under Properties=>Layout, the Column dimensions option specifies the column height and width.
Column order
Under Properties=>Layout, the Column order option hides or displays individual columns, and specifies the order of columns across the monitor.
Monitor style
Under Properties=>Layout, the Monitor style option specifies styles and skins (sets of styles) for the monitor, and the Card design option specifies how information is displayed in the cells of extension, agent, and employee monitors.
Cascade
When you right-click a monitor tab, under Windows, the Cascade command distributes active monitors down and across the Contact Center Client window.
Tile vertically
When you right-click a monitor tab, under Windows, the Tile vertically command distributes active monitors across the Contact Center Client window.
Tile horizontally
When you right-click a monitor tab, under Windows, the Tile horizontally command distributes active monitors down the Contact Center Client window.
Dock Contact Center Client
When you right-click a monitor tab, under Windows, the Dock Contact Center Client command docks Contact Center Client at the top, bottom, left, or right of your desktop.
Always on top
When you right-click a monitor tab, under Windows, and select the Always on top command, Contact Center Client always displays on your desktop on top of all other open applications.
View
The View command hides or displays the main menu, status bar, real-time monitors, voice, email, chat, and SMS legends.
DIAGNOSTICS MONITOR
The log and error monitors are accessed via Contact Center Client. To access log and error monitors
- Click Tools in the Contact Center Client ribbon.
- Click either Log Monitor or Error Monitor, depending on what kind of log information you want to review.
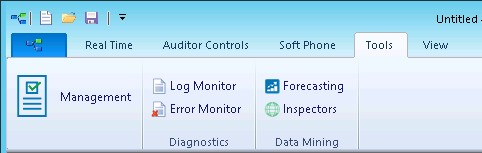
Figure 14: Diagnostics monitors
VIEWING AGENT AVAILABILITY
Contact Center Client provides instant messaging capabilities for both supervisors and agents and is typically used by contact center employees. Contact Center Chat provides the online chat presence of contact center employees, including Online, Offline, and Away. On the agent, employee, and extension monitors, agents can view the availability and presence of other contact center employees before they transfer calls or send online chat messages. (See Figure 15.)
If an agent cell in a monitor is grayed out, the phone is not connected to the network and considered out of service. The out of service state applies to phones that are not connected to the network, remote agents and employees that have lost their Internet connection, phones that are physically disconnected or malfunctioning, or employees that are not logged into their soft phone.
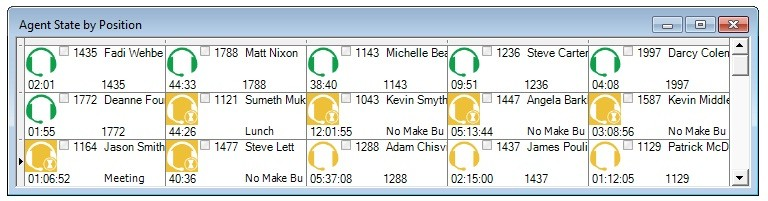
Figure 15: Agent State by Position • viewing agent availability and online presence
With the addition of Microsoft Skype for Business Server, agents and supervisors use Skype for Business Client as their default instant messaging client. The presence of all company employees is natively delivered in Contact Center Client. Contact center employees can view the presence of both internal and external contacts to determine if they are available to communicate. In addition to Available, Offline, and Away, employees see In a Meeting, Busy, In a call, Do Not Disturb, Be Right Back, and other presence indicators. (See Figure 16.)
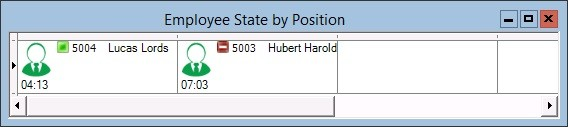
Figure 16: Employee State by Position • viewing employee availability and enhanced presence
The following monitors display agent activities:
- Agent State by Position
- Employee State by Position
- Extension State by Position
- Agent State by Time
- Employee State by Time
- Agent Shift
Extension, Agent, and Employee State by Position
The Extension, Agent, and Employee State by Position monitors provide real-time information in cells that you can arrange to mirror your floor plan: you can view extensions, agents, or employees by their physical position in your contact center. In addition, these monitors enable you to view the current status of general business extensions. Card designs enable you to customize the information displayed in the cells.
Agents can join multiple agent groups and therefore answer for multiple queues. However, each agent has only one ID and displays in a single cell of each applicable monitor. The agent activity that displays in the monitor cell reflects their current overriding action.
When you first open a monitor, you can select a card design:
- The Classic card displays the agent state, time in the state, presence, agent/employee name, agent login ID/employee ID, and extension number (or queue name for voice agents on ACD or on ACD Hold).
- The Caller ID card displays the caller name and number (ANI), the number the caller/employee dials for incoming/outgoing calls, the state, time in the state, presence, agent/employee name, agent login ID/employee ID, and extension number (or queue name for voice agents on ACD or on ACD Hold).
- Custom cards you create and share display customized extension/agent/employee and/or caller information.
Caller ID information is displayed when:
- Extensions, Agents, and employees are in the following real-time states: ACD, ACD Hold, Ringing, Non ACD, Non ACD Hold, Out, and Out Hold Time
- Extensions are in the following real-time states: Inbound and Outbound
You can set alarms for all real-time statistics and for caller ID information, such as the caller name and number.
NOTE: Before you can select the Caller ID card on the Add devices window of monitors, you must make the card available. To do so, right-click an open monitor, select the Caller ID card under Properties, Layout=>Card design and click Apply.
In a fault tolerant setup, if a network outage occurs the cells in the agent, employee, and extension monitors display a crisscrossed pattern to identify agents who have homed to their secondary controllers.
If an agent cell in a monitor is grayed out, the phone is not connected to the network and considered out of service. The out of service state applies to phones that are not connected to the network, remote agents and employees that have lost their Internet connection, phones that are physically disconnected or malfunctioning, or employees that are not logged into their soft phone.
Viewing the activities of agents who can log on to multiple voice queues
In Figure 17, the Agent State by Position monitor shows three cells for Andre Bourque, each with a different agent ID. The first two cells show Andre logged off of the telephone system. The third cell shows Andre's current state. Andre is logged on to Queue 151 using Agent ID 2013. He has been on an ACD call for 12 minutes and 50 seconds.
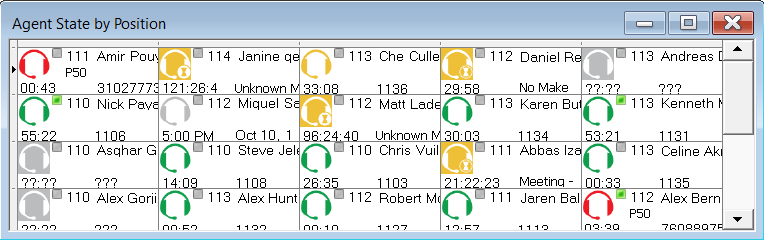
Figure 17: Agent State by Position · viewing multiple agent IDs
Agents can log on to the telephone system using only one agent ID at a time. If your agents have multiple voice IDs (and therefore multiple cells) the Agent State by Position monitor becomes cluttered.
If you have agents who are cross trained to answer calls for different departments (and log in and out of various voice queues) the telephone system requires you assign the agents multiple IDs. You can use the Agent State by Position monitor to view the activities of each department. You create an Agent State by Position monitor for each department. When you arrange the cells for the agents in the same order for each department, you can easily compare the activities of one department with another.
Viewing the current logged on states of agents who log on to multiple queues
If you have voice agents who are cross trained to answer calls for different departments (and log in and out of several queues) the telephone system requires you assign the agents multiple IDs. If a voice agent has multiple agent IDs and you want to view the agent's current logged on state only, you use the Employee State by Position monitor.
To view the monitor, you open the Employee State by Position monitor and select employees to add to the monitor. The monitor shows one cell for Andrew, listing his current state and agent ID. (See Figure 18.)
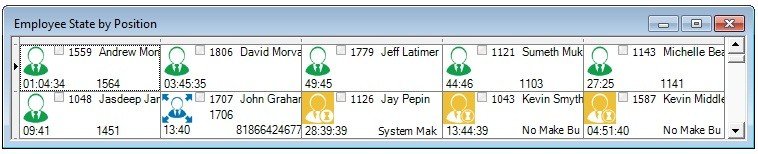
Figure 18: Employee State by Position • viewing the ID to which the agent is logged on
Andrew is currently logged on to Extension 1564 using Agent ID 1559. Sometime later you notice
Andrew is logged on to Extension 1059 using Agent ID 1788. (See Figure 19.)
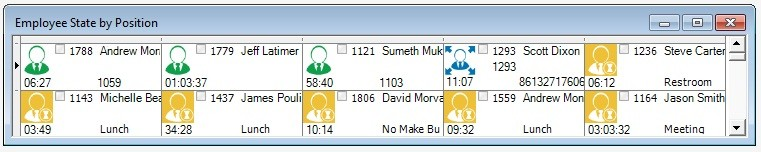
Figure 19: Employee State by Position
Agent State and Employee State by Time
The Agent State by Time and Employee State by Time monitors provide real-time agent information under ACD, Idle, Non ACD, Unavailable, and Logged Off column headings. They display the same real-time information as that of the Extension State by Position, Agent State by Position, and Employee State by Position monitors.
If an agent is in an email, chat, or SMS agent state, the monitors display the queue number to which the agent is logged on. Each column lists agents in order of time in state. You can specify which columns of agent statistics are displayed, and the order in which they are displayed. You can sort logged off agents by the longest logged off first. (See Figure 20.)
If you have agents who are cross trained to answer calls for different departments (and log in and out of various voice queues) the ACD routing system requires you assign the agents multiple IDs. You use the Employee State by Time monitor to view the activities of voice agents with multiple agent IDs.
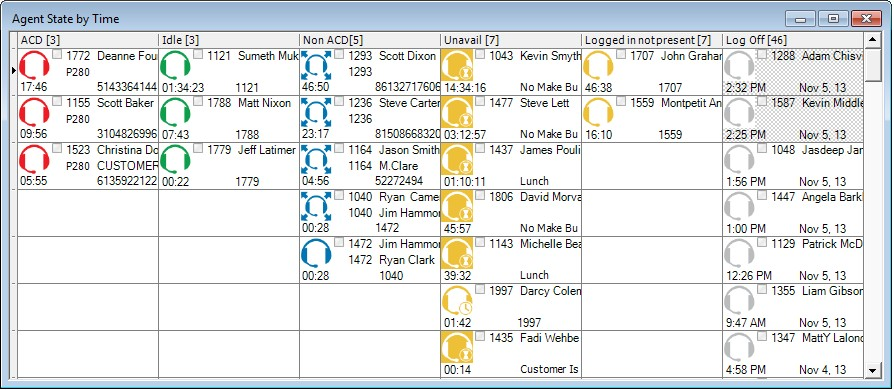
Figure 20: Agent State by Time
Table 5 lists the Agent State by Time and Employee State by Time column headings and their associated agent states.
Table 5: Agent State by Time and Employee State by Time column headings
| CATEGORY | ASSOCIATED AGENT STATES |
|---|---|
| ACD | includes agents in ACD and agents in ACD Hold |
| Idle | Idle includes agents in the Idle state |
| Non ACD | Non ACD includes agents in Non ACD, in Non ACD Hold, Outbound agents, and Outbound |
| Unavailable | Unavailable includes agents in Do Not Disturb, Make Busy, Work Timer, Reseize Timer, and Unknown |
| Logged in not present | includes agents logged in but not present to any of their agent groups, and agents not present to a media type across all groups |
| Log Off | includes agents in the Logged Off and Offline (Ignite, WEB) states |
Agent State by Time for Queue
The Agent State by Time for Queue monitor is a Contact Center Client real-time monitor designed specifically for contact centers using Agent Group Presence functionality. However, the Agent State by Time for Queue monitor is available for all media server types.
The Agent State by Time for Queue monitor is accessed from the Real Time tab in Contact Center Client and displays all agents configured in a specific queue and agents who are on ACD calls, idle, on non-ACD calls, unavailable, logged on to the system (but not present in the queue being monitored), and logged off. (See Figure 21).
NOTE:
- Virtual queue groups are shown under the Virtual queue groups section of the Agent State by Time for Queue monitor. Any Agent State by Time for Queue monitors that are monitoring virtual queues are marked in the title as (virtual).
- The Agent State by Time for Queue monitor does not support viewing Ring Groups.
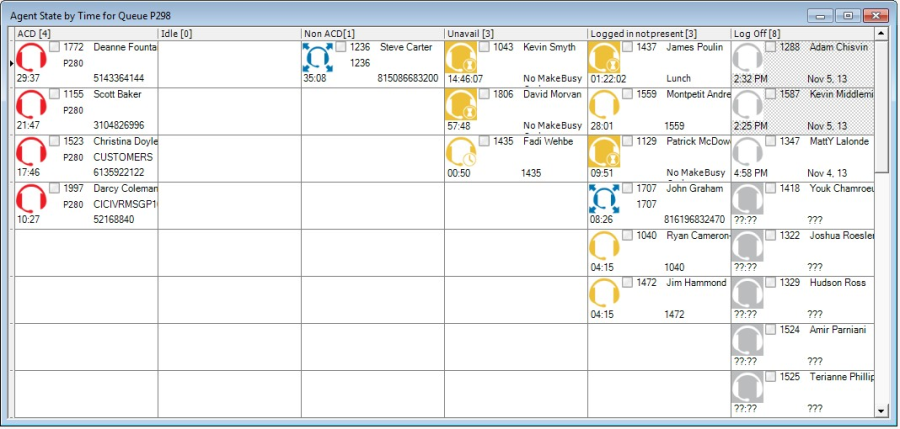
Figure 21: Agent State by Time for Queue
Table 6 lists the Agent State by Time and Employee State by Time column headings and their associated agent states.
Table 6: Agent State by Time for Queue column headings
| CATEGORY | ASSOCIATED AGENT STATES |
|---|---|
| ACD | includes agents in ACD and agents in ACD Hold |
| Idle | Idle includes agents in the Idle state |
| Non ACD | includes agents in Non ACD, in Non ACD Hold, Outbound agents, and Outbound Hold agents |
| Unavailable | includes agents in Do Not Disturb, Make Busy, Work Timer, and Reseize Timer |
| Logged in not present | includes agents logged in but not present to any of their agent groups, and agents not present to a media type across all groups |
| Log Off | includes agents in the Logged Off, Unknown, and Offline (Ignite, WEB) states |
To view the Agent State by Time for Queue monitor
- In the Contact Center Client ribbon, click the Real Time tab.
- In the State by Time column on the ribbon, click Agent by Queue.
- Select the queues to monitor. You can optionally sort members in either ascending or descending order.
- Click OK.
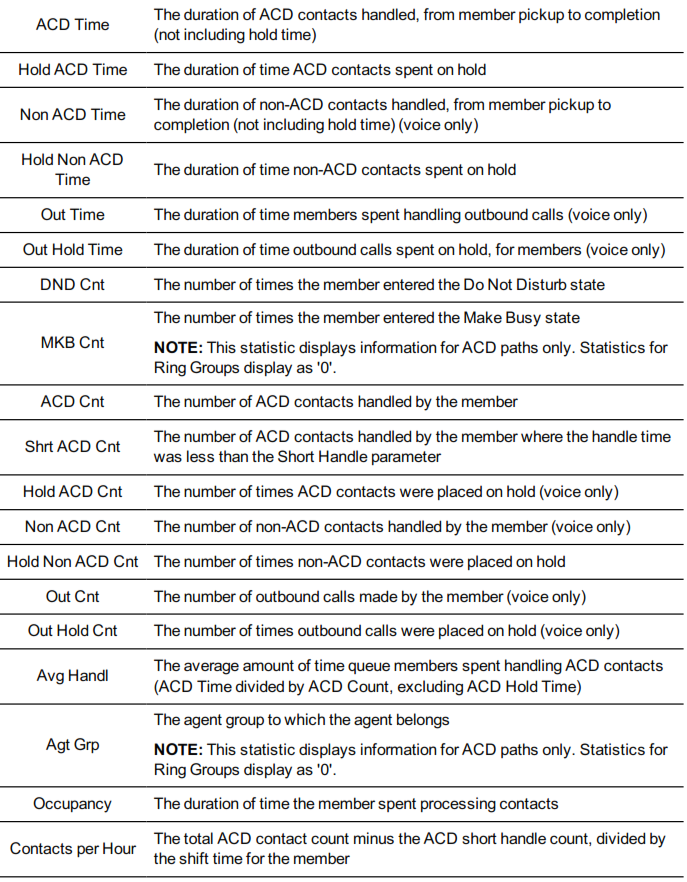
Agent Shift
The Agent Shift monitor provides running totals of statistics on individual agents for the day. You can specify which columns of statistics are displayed, rearrange columns, and sort individual columns in ascending or descending order. (See Figure 22.)
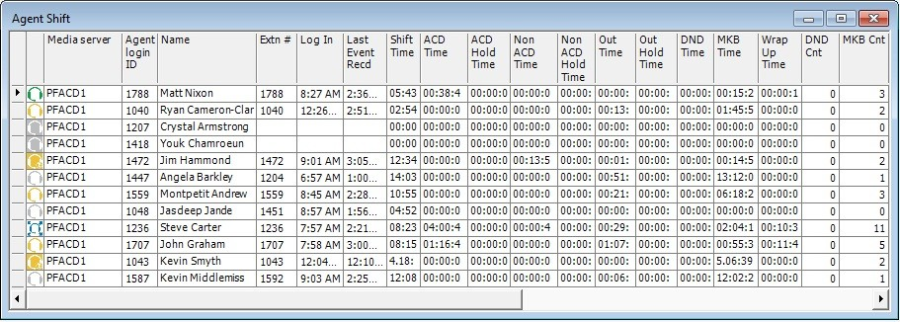
Figure 22: Agent Shift
Agent Shift column heading definitions
Table 7 describes the Agent Shift column headings.
Table 7: Agent Shift column headings
TERM | ABBREVIATED NAME | MEANING |
Agent State | Agent State | The agent's media type and current state |
Media Server | Media Server | The media server to which the agent is associated |
Agent Shift Name | Name | The name of the agent being monitored |
Agent login ID | Agent login ID | The login ID of the agent being monitored |
| Extension Number | Extn # | The extension where the agent logged in (voice only) |
| Logged On | Log In | The most recent time the agent logged in |
| Last Event Received | Last Event Recd | The most recent time an agent event occurred |
| Shift Time | Shift Time | The total elapsed time logged for the agent, calculated based on the difference between log in and last event received |
| ACD Time | ACD Time | The duration of ACD contacts handled, from agent pickup to completion (not including hold time) |
| ACD Hold Time | ACD Hold Time | The duration of time ACD contacts spent on hold |
| Non ACD Time | Non ACD Time | The duration of non-ACD contacts handled, from agent pickup to completion (not including hold time) (voice only) |
| Non ACD Hold Time | Non ACD Hold Time | The duration of time non-ACD contacts spent on hold |
| Outbound Time | Out Time | The duration of time agents spent handling outbound calls (voice only) |
| Outbound Hold Time | Out Hold Time | The duration of time outbound calls spent on hold, for agents (voice only) |
| Do Not Disturb Time | DND Time | The duration of time the agent entered the Do Not Disturb State |
| Make Busy Time | MKB Time | The duration of time the agent entered the Make Busy state |
| Wrap Up Time | Wrap Up Time | The duration of time where Wrap Up Time was the overriding state for the agent. Wrap up time does not include any time spent making or taking contacts during the wrap up timer |
| Do Not Disturb Count | DND Cnt | The number of times the agent entered the Do Not Disturb state |
| Make Busy Count | MKB Cnt | The number of times the agent entered the Make Busy state |
| ACD Count | ACD Cnt | The number of ACD contacts handled by the agent |
| Short ACD Count | Shrt ACD Cnt | The number of ACD contacts handled by the agent where the handle time was less than the Short Handle parameter |
| Non ACD Count | Non ACD Cnt | The number of non-ACD contacts handled by the agent (voice only) |
| Hold ACD Count | Hold ACD Cnt | The number of times ACD contacts were placed on hold (voice only) |
| Non ACD Hold Count | Non ACD Hold Cnt | The number of times non-ACD contacts were placed on hold |
| Outbound Count | Out Cnt | The number of outbound calls made by the agent (voice only) |
| Outbound Hold Count | Out Hold Cnt | The number of times outbound calls were placed on hold (voice only) |
| Contacts Per Hour | Contacts Per Hour | The total ACD contact count minus the ACD short handle count, divided by the shift time for the agent |
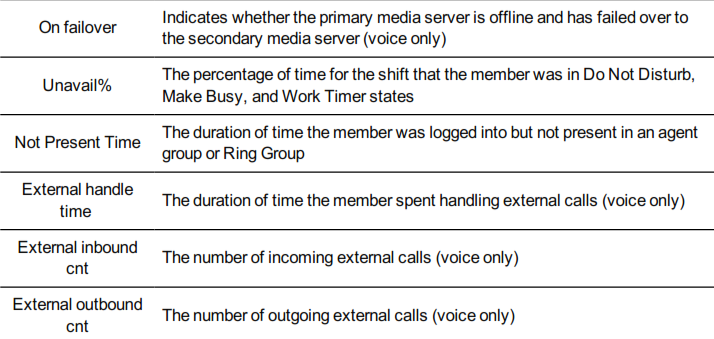
| Agent Unavailable Percent | Agt Unavail % | The percentage of shift time the agent was unavailable to receive contacts |
| Logged In Not Present Time | Logged In Not Present Time | The duration of time the agent was logged into but not present to any of their agent groups, and the duration of time the agent was not present to a media type across all groups |
| Average Handle | Avg Hndl | The average amount of time the agent spent handling ACD contacts (ACD Time divided by ACD Count, excluding ACD Hold Time) |
| Occupancy | Occp | The duration of time the agent spent processing contacts, including ringing time |
Viewing Agent and Extension Availability and Resiliency
Contact Center Client's Agent, Employee, and Extension real-time monitors provide a visual indication if agents fail over to a resilient media server. In an Agent monitor (Agent State by Position, Agent State by Time, and Agent State by Queue by Time), if an agent fails over to the secondary voice media server, a cross-hatch pattern displays in the agent's cell in the monitor. (See Figure 23.)
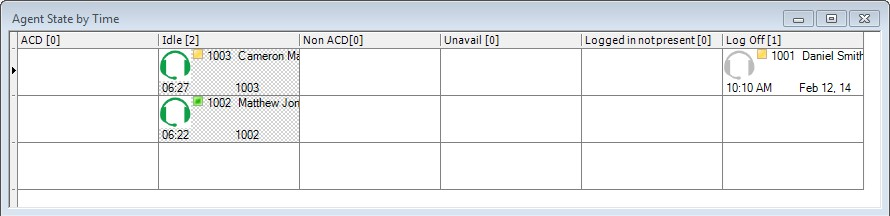
Figure 23: Agent monitor with failed over agents
In an Employee monitor (Employee State by Position and Employee State by Time), if an employee's agent fails over to the secondary voice media server, a cross-hatch pattern displays in the employee's cell in the monitor. (See Figure 24.)
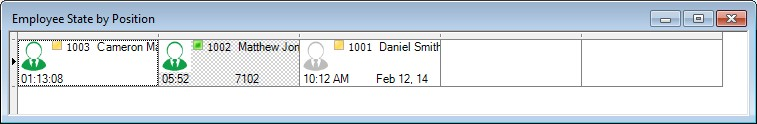
Figure 24: Employee monitor with failed over agents
In an Extension monitor, if a logged in agent who is associated to an extension fails over to the secondary voice media server, then a cross-hatch pattern is applied to the agent's associated extension in the extension monitor. (See Figure 25.)
NOTE: Extensions that fail over to the secondary voice media server do not have a cross-hatch pattern applied to their cell.
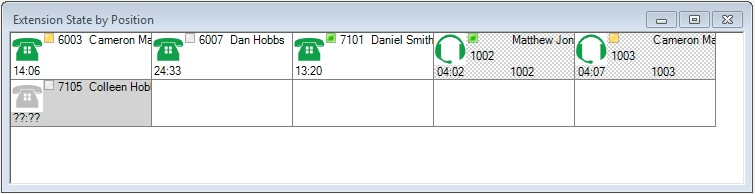
Figure 25: Extension monitor with failed over agents
Modifying visual indicator settings for agents failing over
By default, monitors are configured to display a pattern if agents fail over to a secondary media server. This setting is optional, however, and can be disabled on a monitor-by-monitor basis.
The following procedures explain how to
- Disable visual indicators for agents failing over
- Enable visual indicators for agents failing over
To disable visual indicators for agents failing over
- Right-click in an open monitor and select Properties.
- In the General tab, clear Display pattern when on failover.
- Click OK.
To enable visual indicators for agents failing over
- Right-click in an open monitor and select Properties.
- In the General tab, select Display pattern when on failover.
- Click OK.
VIEWING EXTENSIONS
In your business, you may be monitoring
- Traditional or hot desking ACD agents who sit at different desks each day and who log on using their agent ID
- General business, traditional extensions (non-contact center employees) who sit at the same desks each day, are assigned their own desk phone extensions, and do not log on to their phones (their phones are programmed with their personal settings and are always active)
- General business, hot desking extensions (non-contact center employees) who log on to any phone in the enterprise with a virtual extension configured with their personal settings. When the employee logs on the extension becomes active. When the employee logs off of the extension it goes out of service.
The following monitors are available for viewing extensions:
- Extension State by Position
- Extension Now
You can set up your real-time monitor profile to include two or more Extension by Position monitors: one with cells that are arranged to show the whereabouts of agents in your contact center, and another that shows the status of general business extensions: active/inactive, inbound/outbound.
Extension Inbound
Extension Inbound refers to a general business extension on an inbound call.
Extension Outbound
Extension Outbound refers to a general business extension on an outbound call
General business active extension
General business active extension refers to a Mitel desk phone/Contact Center PhoneSet Manager/Contact Center Softphone that is live with no ACD agents logged on (active extension), or an extension to which a general business hot desking user is logged on. The user is an active extension not logged on to any ACD queue.
General business inactive extension
General business inactive extension refers to a Mitel desk phone that has been unplugged or is damaged, or a soft phone that is not running because the computer is turned off or Contact Center Client is not running, or a hot desking extension to which nobody is logged on.
Traditional or hot desking ACD agents who sit at different desks each day
If you have traditional or hot desking ACD agents who sit at different desks each day, you use the Extension State by Position monitor to view where they are sitting in the contact center. After you add Registration Directory Numbers (RDNs)/desk phone extensions to the monitor, you can arrange the cells to match the layout of your contact center.
When nobody is logged on to a particular extension, the monitor cell displays the General business active icon and the phone set RDN ID. When an agent logs on to the desk phone, the monitor cell displays the ACD agent status, (which can include information such as the time in state, queue reporting number, and Make Busy status), the agent ID, the agent name, and the RDN (at the bottom of the cell). Depending on the agent's current state you may see additional information, such as the time in state, queue reporting number, or Make Busy status. If the Caller ID card design is selected, you will also see the caller name and phone number. (See Figure 26.)
If you would prefer that Extension State by Position monitor cells be blank when there are no agents logged on to the telephone system, you can right-click the monitor, select Properties, and clear the Enable the general business view check box.
If an agent cell in a monitor is grayed out, the phone is not connected to the network and considered out of service. The out of service state applies to phones that are not connected to the network, remote agents or employees that have lost their Internet connection, phones that are physically disconnected or malfunctioning, or employees that are not logged into their soft phone.
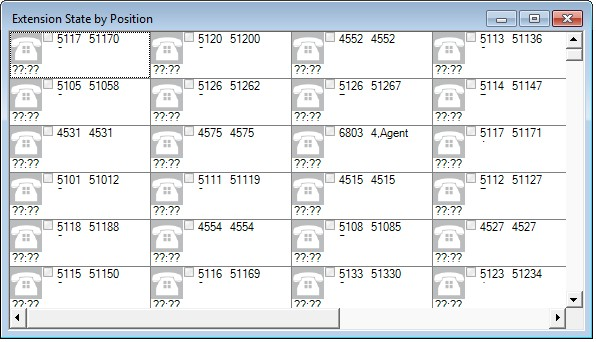
Figure 26: Extension State by Position
General business, traditional extensions who sit at the same desks each day
If you have general business, traditional extensions who sit at the same desks each day, you use the Extension State by Position monitor to view where they are sitting in the contact center. After you add their extensions to the monitor, you can arrange the cells to match the layout of your business, or arrange them alphabetically or by department.
When a general business employee is in Idle, the cell for the employee's phone extension in the Extension State by Position monitor displays the employee's name and extension number, and the General business active icon. When the employee is on an incoming/outgoing call, the cell displays the Extension Inbound/Extension Outbound icon, the employee's name and extension number, and the time in state. If the Caller ID card design is selected, you will also see the caller name and phone number. Either card enables you to readily determine the online and phone availability of general business subject matter experts.
General business hot desking employees who sit at different desks each day
General business, hot desking extensions can log on to any phone in the enterprise and access their personal settings. When adding extensions to the Extension State by Position monitor, you can arrange them alphabetically or by department.
When an employee is logged on, the monitor cell displays the General business active icon, the employee's name and extension. When the employee is on an incoming/outgoing call, the cell displays the Extension Inbound/Extension Outbound icon and the time in state. If the Caller ID card design is selected, you will also see the caller name and phone number. When the employee logs off, the monitor cell is grayed out (inactive). (See Figure 27.)
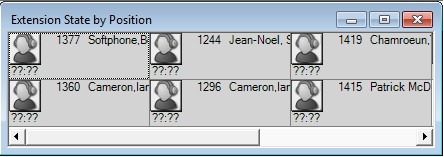
Figure 27: Extension State by Position
Extension Now
The Extension Now monitor enables supervisors to view extension statistics in real time. The Extension Now monitor provides visibility to extensions. If an agent logs out of an extension displayed in this monitor, the extension will go out of service and will not be updated in real time. In the Extension Now monitor, you can specify which columns of statistics are displayed, rearrange columns, and sort individual columns in ascending or descending order. (See Figure 28.)
NOTE: Extensions must be licensed to display statistics.
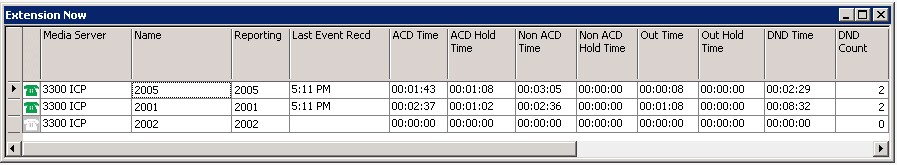
Figure 28: Extension Now monitor
Extension Now column heading definitions
Table 8 indicates the current status of the extension and describes the real-time and over-the- business-day Extension Now extension statistics.
Table 8: Extension Now extension statistic column headings
| TERM | MEANING |
|---|---|
| Media Server | The extension's media server |
| Name | The extension name |
| Reporting | The extension's reporting number NOTE: The extension reporting number is also its dialable number. |
| Last Event Recd | The most recent time an extension event occurred |
| ACD Time | The duration of ACD (Ring Group) contacts handled, from extension pickup to completion (not including hold time) |
| ACD Hold Time | The duration of time ACD (Ring Group) contacts spent on hold |
| Non ACD Time | The duration of non-ACD contacts handled, from extension pickup to completion (not including hold time) |
| Non ACD Hold Time | The total time for non-ACD calls put on hold |
| Out Time | The number of outbound calls made by the extension |
| Out Hold Time | The duration of time outbound calls spent on hold for extensions |
| DND Time | The duration of time where Do Not Disturb was the overriding state for the extension |
| DND Cnt | The number of times the extension entered the Do Not Disturb state |
| ACD Cnt | The total number of ACD (Ring Group) calls answered by the extension |
| Shrt ACD Cnt | The total number of ACD (Ring Group) calls answered by the extension that lasted less than the Short Handle parameter |
| ACD Hold Cnt | The number of times the extension put ACD (Ring Group) calls on hold |
| Non ACD Cnt | The total number of non-ACD calls answered by the extension |
| Non ACD Hold Cnt | The number of times non-ACD calls were put on hold |
| Out Cnt | The total number of outgoing calls the extension made |
| Out Hold Cnt | The total number of times the extension put outgoing calls on hold |
| Calls Per Hour | The average number of incoming ACD calls answered by the extension per hour since the extension was logged in |
| Not Present Time | The duration of time the extension was in service but not present in a Ring Group |
| Avg Handl | The average amount of time the extension spent handling ACD contacts (ACD Time divided by ACD Count, excluding ACD Hold Time) |
| Occp | The total time the extension spent in an occupied state (occupied state excludes idle time) |
VIEWING QUEUE STATISTICS
NOTE: If an agent fails to answer an ACD call after X seconds or X rings, the ACD routing system either logs out the agent or removes their presence from all agent groups (depending on ACD routing system configuration). The ACD routing system then re-queues the call, in the same queue, and offers it to the next available agent.
The following monitors display queue statistics:
- Queue by Period
- Queue Now
- Queue Group Now
Queue by Period
The Queue by Period monitor collates queue statistics by 15-minute intervals over a 24-hour period. The monitor refreshes each time there is a change in a statistic and each 15-minute interval. The Queue by Period monitor always displays the current 15 minute interval at the top of the monitor. You can specify which columns of statistics are displayed, rearrange columns, and sort individual columns in ascending or descending order. (See Figure 29.)
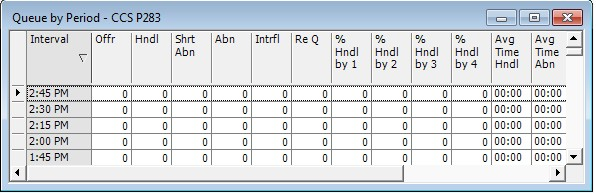
Figure 29: Queue by Period
Queue by Period column heading definitions
Table 9 describes the Queue by Period column headings.
NOTE: Statistics that do not support Ring Groups display as 'O'.
Table 9: Queue by Period column headings
| TERM | ABBREVIATED NAME | MEANING |
|---|---|---|
| Interval time | Interval | The 15 minute interval of time |
| Offered | Offr | The total number of calls offered to the queue during the 15-minute interval |
| Handled | Hndl | The total number of calls answered by members during the 15-minute interval |
| Short Abandoned | Shrt Abn | During the 15-minute interval, the total number of calls abandoned before the short abandon time configured against the queue in YourSite Explorer |
| Abandoned | Abn | The total number of calls abandoned during the 15-minute interval before being answered by members |
| Interflowed | Intrfl | The total number of calls interflowed during the 15-minute interval |
| Requeued | Re Q | The total number of calls re-queued during the 15- minute interval. NOTE: This statistic displays information for ACD paths only. Statistics for Ring Groups display as 'O'. |
| % Handled by 1-4 | % Hndl by 1-4 | A count of all of the calls answered by the first, second, third, and fourth answer points during the 15-minute interval. NOTE: This statistic displays information for ACD paths only. Statistics for Ring Groups display as 'O'. |
| #Handled by 1-4 | #Hndl by 1-4 | The number of calls answered by the first, second, third, and fourth answer points during the 15-minute interval. NOTE: This statistic displays information for ACD paths only. Statistics for Ring Groups display as 'O'. |
| Total Conversation Time | Ttl Conv Time | The total time members spent talking to callers during the 15-minute interval |
| Average Conversation Time | Avg Conv time | The average time members spent talking to callers during the 15-minute interval |
| Average Time to Handle | Avg Time Hndl | The average amount of time callers waited in queue before members answered their calls during the 15-minute interval |
| Average Time to Abandon | Avg Time Abn | The average amount of time callers waited in queue during the 15-minute interval before they abandoned their calls |
| Average Time to lnterflow | Avg Time lntrfl | The average amount of time callers waited in queue during the 15-minute interval before being interflowed |
| Service Level % Today | Scv Lvl % Tday | During the 15-minute interval, the percentage of calls answered within the Service Level Time specified for the queue |
| % Handled | % Hndl | During the 15-minute interval, the percentage of calls answered compared to the total number of calls offered to the ACD queue for the day |
| Wrap Up | Wrap Up | The total time the agent spent in the Work Timer state during the 15-minute interval NOTE: This statistic displays information for ACD paths only. Statistics for Ring Groups display as 'O'. |
| Make Busy | Make Busy | The total time the agent spent in the Make Busy state during the 15-minute interval NOTE: This statistic displays information for ACD paths only. Statistics for Ring Groups display as 'O'. |
| Occupancy | Occp | The total time the queue members spent in an occupied state during the 15-minute interval (occupied state excludes idle time) |
Queue Now and Queue Group Now
The Queue Now monitor enables supervisors to view queue statistics in real time, as well as expand individual queues in the monitor to view statistics on each queue's associated member agents or extensions. When you expand the Queue Now monitor to display the Name column, the monitor also displays member presence in the queue. Presence is indicated by a colored star in the Present column. A green star indicates the member is present in the queue. A gray star indicates the member is not present in the queue. A gray row indicates that the member is not logged in (for agents and hot desk users) or out of service (for extensions).
The Queue Group Now monitor enables supervisors to view aggregated statistics for Reporting, Virtual, and Unified queue groups in real-time, as well as expand individual queue groups in the monitor to view statistics for the queue group's associated queues.
On the Queue Now monitor, you can specify which columns of statistics are displayed, rearrange columns, and sort individual columns in ascending or descending order. You can expand a queue and view statistics on the members associated with the queue. (See Figure 3O.)
NOTE: Prior to Version 7.1, Queue Now monitors displayed the agent groups belonging to the queues with agent group statistics. As of Version 7.1, this functionality has been removed. Instead, queue members are grouped by agent group.
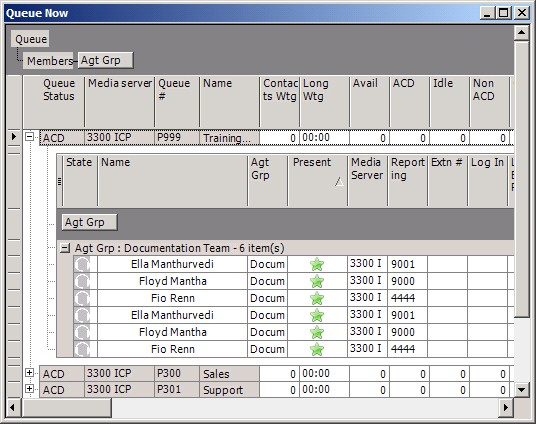
Figure 30: Queue Now
NOTE:
- Virtual queue groups are shown under the Queue groups column in the Queue Now monitor so that their individual queues can be selected in a single operation.
- Contact Center Client updates Longest Waiting statistics every fifteen seconds, or more frequently as records are received from the ACD routing system.
- If the ACD routing system has not updated MiContact Center with real-time statistics for Contacts Waiting and Agents Available within the last 90 seconds, question marks display in place of these statistics.
- Agents present to the queue and idle whose extensions are ringing are included in 'Available' statistics. Agents whose extensions are ringing are not included in Unavailable statistics.
- The Average Handling Time is the Average Conversation Time plus the Average Hold Time. If the call is put on hold, transferred, or conferenced, these times are added to the Average Handling time value.
- If an agent fails to answer an ACD call after X seconds or X rings, the ACD routing system either logs out the agent or removes their presence from all agent groups (depending on ACD routing system configuration). The ACD routing system then re-queues the call, in the same queue, and offers it to the next available agent.
- The abandoned media column in the Interactive Visual Queue monitor displays all abandoned calls. The abandoned column in the Queue Now monitor does not include short abandons as abandoned calls. Because of this difference, you may notice discrepancies between the abandoned call information in these two monitors.
- Statistics that do not support Ring Groups display as 'O'.
Queue Now and Queue Group Now column heading definitions
Table 1O describes the real-time and over-the-business-day Queue Now and Queue Group Now queue and queue group statistics.
NOTE: Statistics that do not support Ring Groups display as 'O'.
Table 10: Queue Now and Queue Group Now queue statistic column headings
TERM ABBREVIATED NAME MEANING
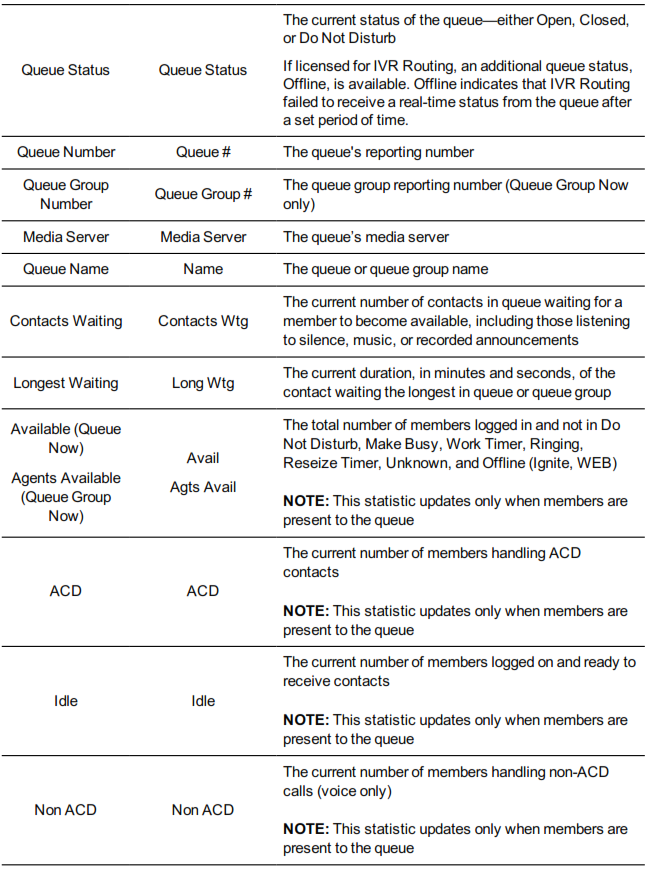
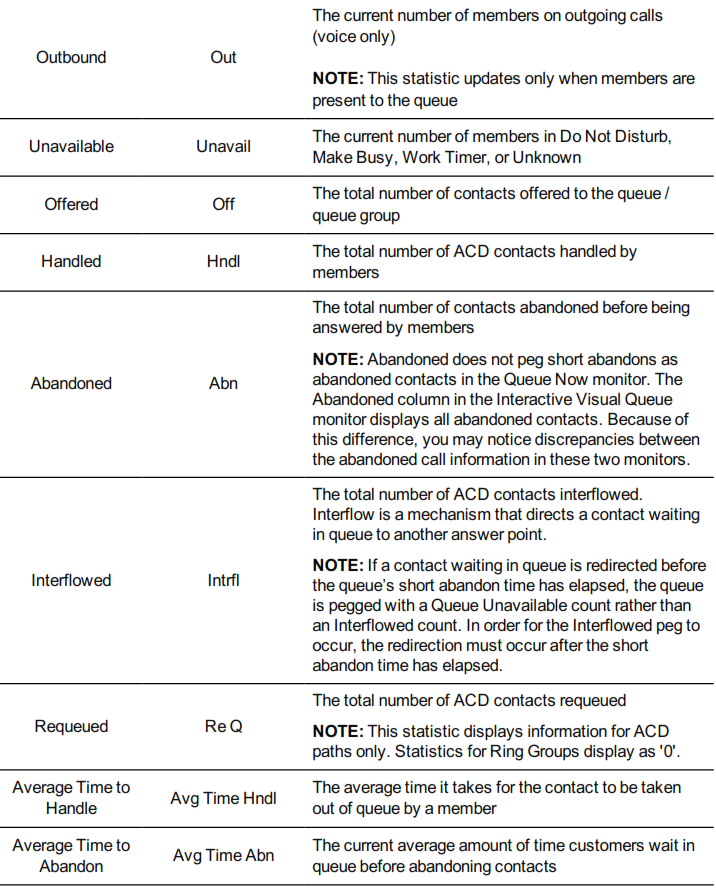
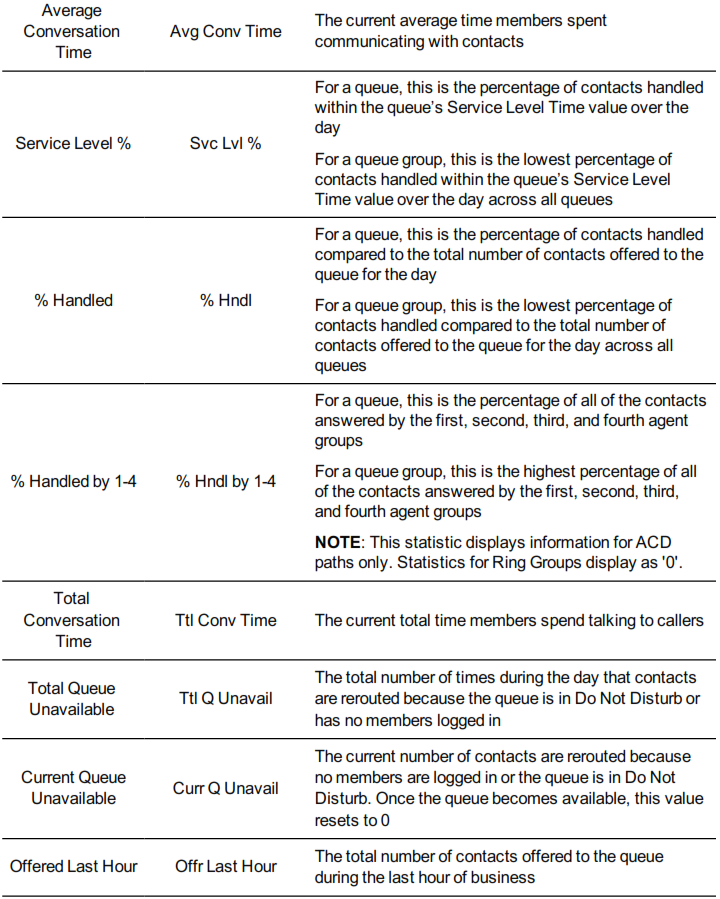
Table 11 describes the real-time and over-the-business-day Queue Now and Queue Group Now member statistics.
NOTE: Some statistics in the Queue Now monitor display in the Queue Group Now monitor as member statistics.
Table 11: Queue Now and Queue Group Now member statistic column headings
TERM MEANING
VIEWING QUEUE CHART STATISTICS
The following charts display queue statistics:
- Queue Now
- Queue Group Now
- Queue Performance by Period
- Queue Group Performance by Period
Queue Now and Queue Group Now
The Queue Now and Queue Group Now charts offer visual representations of Queue Now and Queue Group Now real-time statistics, grouped by the type of statistics displayed. Three different series of statistics are available to view in charts:
- Integer-displays numerically-based real-time statistics
- Percentage-displays percentage-based statistics
- Time-displays time-based statistics
Users can specify which statistics display in their charts. Figure 31 shows an example of a Queue
Now chart displaying the Integer series with the default statistics selected.
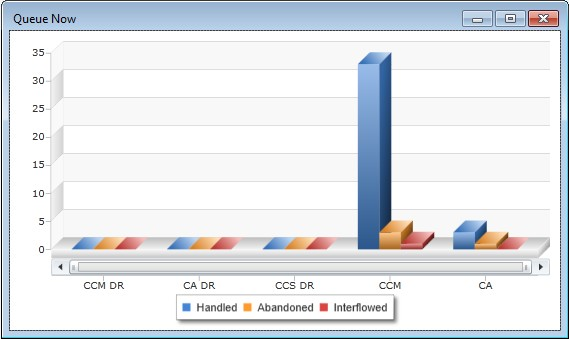
Figure 31: Queue Now (Integer) chart
The lnteger chart shows:
- Handled (Default)
- Abandoned (Default)
- lnterflowed (Default)
- Calls Waiting
- Agents Available
- ACD
- ldle
- Non ACD
- Outbound
- Unavailable
- Offered
- Requeue
- Total Hour
- lnterflowed Last Hour
- Unavailable Last Hour
- Offered Last 15 Minutes
- Handled Last 15 Minutes
- Abandoned Last 15 Minutes
- lnterflowed Last 15 Minutes
- Unavailable Last 15 Minutes
- Logged out
- Logged in not present
- # Handled by 1-4
The Percentage chart shows, by default:
- Service Level %
- Handled %
- % Handled by 1-4
- % Handled Last Hour
- Service Level % last Hour
- % Handled Last 15 Minutes
- Service Level % Last 15 Minutes
- %Abandoned
- %Abandoned Last Hour
- %Abandoned Last 15 Minutes. Time charts show, by default:
- Longest Waiting
- Average Time to Handle
- Average Time to Abandon Minutes
- Average Talk Time
- Ttl Talk Time
- Time to Handle Last Hour
- Average Time to Handle Last Hour
- Hdnl Last 15 Min
- Average Handling Time Last 15 Minutes
- Total work timer minutes
- Total make busy minutes
- Total occupancy minutes
NOTE: The following statistics are for ACD path voice queues only and will not display information for Ring Groups:
- Requeue
- # Handled by 1, 2, 3, 4
- % Handled by 1, 2, 3, 4
- Total work timer minutes
- Total make busy minutes
Queue Performance by Period and Queue Group Performance by Period
The Queue Performance by Period and Queue Group Performance by Period charts offer visual representations of Queue and Queue Group Performance by Period statistics, grouped by the type of statistic displayed. Three different series of statistics are available to view in charts:
- Integer-displays numerically-based real-time statistics
- Percentage-displays percentage-based statistics
- Time-displays time-based statistics
Figure 32 displays a Queue Performance by Period chart displaying the default statistics of the Integer series.
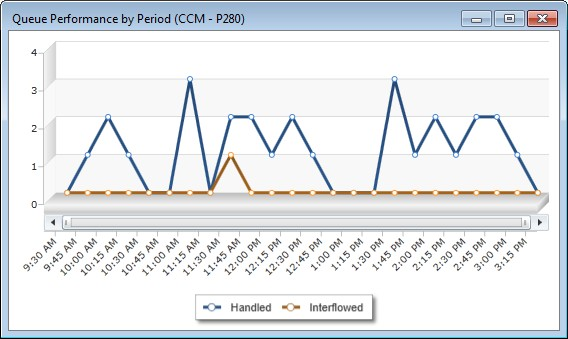
Figure 32: Queue Performance by Period chart
The Integer series shows the following statistics across 15 minute intervals for queues or queue groups:
- Handled (Default)
- Interflowed (Default)
- Offered
- Short Abandoned
- Abandoned
- Requeue
- # Handled by 1-4
The Percentage series shows the following statistics across 15 minute intervals for queues or queue groups, by default:
- % Handled by 1-4
- Service Level % Today
- % Handled
The Time series show the following statistics across 15 minute intervals for queues or queue groups, by default:
- Average Time to Handle
- Average Time to Abandon
- Average Time to lnterflow
- Ttl Talk Time
- Average Talk Time
- Total work timer minutes
- Total make busy minutes
- Total occupancy minutes
NOTE: The following statistics are for ACD path voice queues only and will not display information for Ring Groups:
- Requeue
- # Handled by 1, 2, 3, 4
- % Handled by 1, 2, 3, 4
- Total work timer minutes
- Total make busy minutes
Navigating charts
You can zoom in and out of charts to change how the data is displayed in the chart, expanding or compressing the displayed data. lf the range of data displayed exceeds the boundary of the chart window in Contact Center Client, you can use the horizontal scroll bar to move back and forth across the displayed data.
To zoom in on a chart
- Hold your mouse over the edge of the horizontal scroll bar until the cursor turns into a double- arrow (<->) icon.
- Click and drag the edge of the horizontal scroll bar towards the opposite side of the scroll bar. The chart zooms in and the horizontal scroll bar shrinks in size.
NOTE: To undo the zoom function, click Zoom Out.
To zoom out of a chart
- Hold your mouse over the edge of the horizontal scroll bar until the cursor turns into a double-arrow (<->) icon.
- Click and drag the edge of the horizontal scroll bar and drag to zoom out.
To show the entire chart in the window
- If you are zoomed in, in the chart window click Show All. To scroll across the chart
- Click and drag the horizontal scroll bar in the direction you wish to scroll the chart.
VIEWING CALLBACK LISTS WITH THE GLOBAL CALLBACK MONITOR
When licensed for IVR, the Global callback monitor enables you to monitor callback states in real time and displays the callbacks currently available. Using the Global callback monitor, you can requeue and delete callbacks. (See Figure 33.)
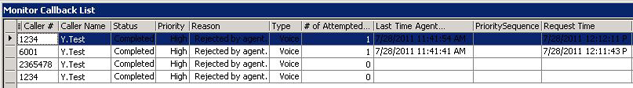
Figure 33: Global callback monitor
To access the global callback monitor
- Click the Real Time tab in the Contact Center Client ribbon.
- Click the Callbacks icon.
The Monitor Callback List displays.
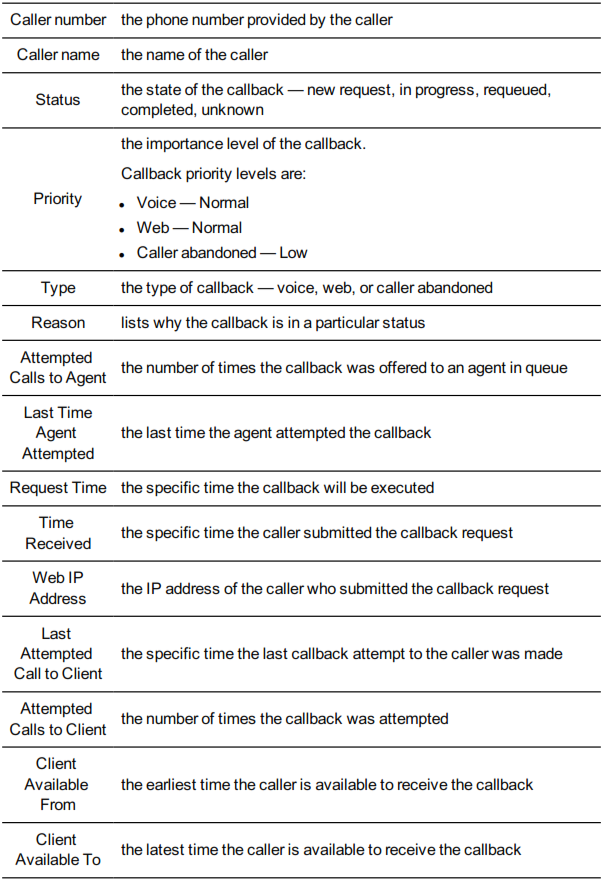
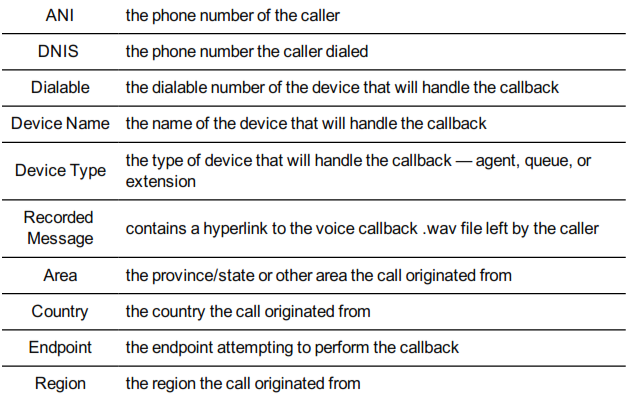
Table 12 describes the Global callback monitor column headings.
Table 12: Global callback column headings
COLUMN HEADING DEFINITION
Managing callbacks in the Global Callback monitor
The Global callback monitor enables users to requeue, reject, and delete callbacks within the monitor. Requeued callbacks are re-entered into their queue. Rejected callback are removed from the queue are will not be offered to employees. Deleted callbacks are removed from the monitor, but are not removed from the system.
Users can also adjust a callback's priority. Callback priority determines the order of which callbacks will be offered to agents. Callbacks are offered to agents in order of their priority and then by the longest waiting callback of that priority. For example, High priority callbacks are offered before Normal priority callbacks, even if the Normal priority callbacks have been in queue longer.
The following procedures explain how to:
- Requeue a callback
- Reject a callback
- Delete a callback
- Change a callback's priority
To requeue a callback
- Right-click a callback and select Requeue.
- Select Yes. To reject a callback
To reject a callback
- Right-click a callback and select Reject.
- Select Yes.
To delete a callback
- Right-click a callback and select Delete.
- Select Yes.
To change a callback's priority
- Right-click a callback and select Change priority=>[priority level].
VIEWING PORTS
NOTE:
- You can monitor port states in real time and view currently executing workflows.
- You can select the ports you want to monitor individually or by hunt group.
- You can remove ports from Do Not Disturb. The Port Status monitor displays port information.
Port status monitor
The Port Status monitor enables you to monitor port states in real time and displays the workflows that are currently executing on ports. Using the Port Status monitor, you can take ports out of Do Not Disturb and playback historical port events in Auditor mode. (See Figure 34.)
To access the port status monitor
- Click the Real Time tab in the Contact Center Client ribbon.
- Click the Ports icon.
The Port status monitor displays.
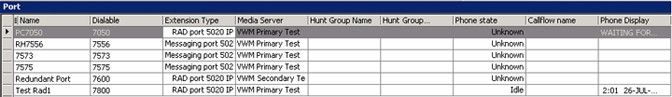
Figure 34: Port status monitor
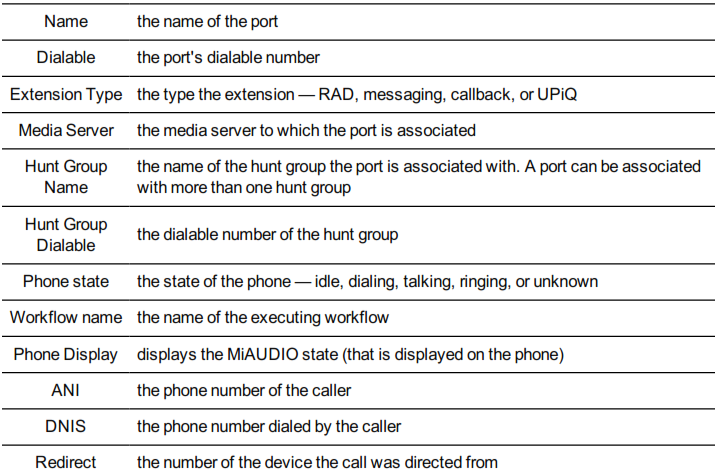
Table 13 describes the Port Status monitor column headings.
Table 13: Port Status column headings
COLUMN HEADING DEFINITION
VIEWING WEBPAGES
While using Contact Center Client, you can view webpages using the Web browser monitor.
To view a webpage within Contact Center Client
- Click the Real Time tab in the Contact Center Client ribbon.
- Click the Web icon. The Web Browser Properties window opens.
- After Monitor title, type a name for the monitor.
- After Start URL, type the address of the website to view.
NOTE: The website address must begin with http:// or you will not be able to view the monitor. - Optionally, select a value for the Web Browser Refresh Rate.
- Click OK.
VIEWING HISTORICAL REAL-TIME EVENTS WITH AUDITOR
Using Auditor you can view historical, multimedia real-time events, at your own pace. Auditor makes it easy for you to analyze when and why past service problems occurred. By understanding the series of events you can prevent such issues from recurring.
For example, you notice that on July 15 you have 12 contacts abandon between 10:00 AM and 10:15 AM. You can review the contacts and the agents' actions on that date for that time period with Auditor. Did all of the contacts arrive at the same time? Did all of the agents go on break at the same time? If all of the contacts arrived at once, you need to schedule more people. If all of the agents went on break at the same time, you need to adjust their break schedule.
Using Auditor you can also track when employees log on and log off the system. It is easy to determine if any of the employees consistently start late or finish early.
With Auditor, you can use existing profiles, including alarm thresholds, when viewing past days run in real time.
Your access to Auditor is determined by administrator-set security roles.
The first toolbar consists of real-time monitors that provide information on agent availability, queue statistics, and graphic displays on queues. (See Figure 35.)
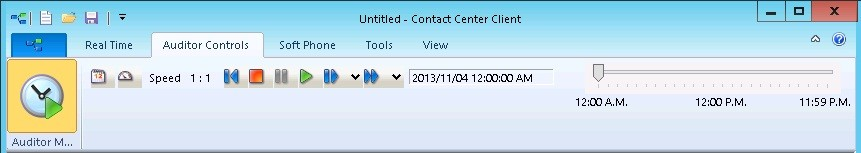
Figure 35: Auditor toolbar
Auditor icons
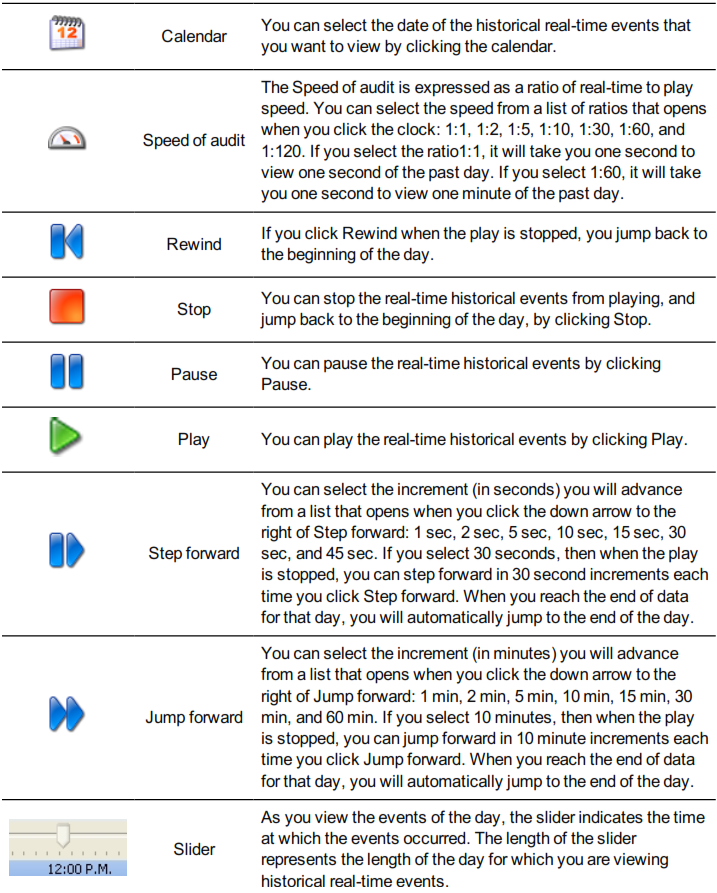
Using Auditor's second toolbar you select the date of the historical real-time events that you want to view and the speed at which to play the events. The icons are described in Table 14.
Table 14: Auditor Icons
ICON TERM MEANING
Starting and using Auditor
You start Contact Center Client to gain access to Auditor functionality.
To view historical real-time events, you must
- Start Contact Center Client.
- Open the grids in which you want to view historical events.
- Start Auditor.
NOTE: If you are using the Contact Center Client marquee, Contact Center PhoneSet Manager, Contact Center Softphone, or Interactive Visual Queue applications (which function in real time only), open Auditor in another instance of Contact Center Client.
To start and use Auditor
- In the Contact Center Client ribbon, click Auditor Controls.
- Click Auditor Mode in the toolbar ribbon. The Auditor toolbar displays.
- Click the calendar icon and select a date. The date displays on the left of the slider.
- Click the speed icon and select the speed of the audit. The speed of the audit, expressed as a ratio of real time to play speed, displays on the right of the speed icon.
- Move the slider to select the time of day at which you want to start monitoring.
- Click the play button to play the real-time events of the selected date. The historical real-time events play at the speed you selected.
VIEWING AND CUSTOMIZING REAL-TIME MONITORS
NOTE:
- Contact Center Client has a tabbed interface for managing and arranging windows. You can dock the monitors, displaying them on overlapping tabbed panels to maximize real estate. This enables you to readily navigate between monitors.
- You can save threshold settings and display characteristics you define for monitors. When you click File=>Save, Contact Center Client saves all open monitors under one profile name. You can click File=>Open to open another profile, or File=>New to create a new profile.
Opening monitors
To open a monitor in Contact Center Client
- In the Contact Center Client ribbon, click Real time to view the Contact Center Client monitor icons.
- In the State by Position column on the ribbon, click Agent. This selects the Agent State by Position monitor and the Add/Remove device IDs window opens. See Figure 36.
- Under Agent groups, select agent groups to monitor and/or under Agents, select agents to monitor.
- Under Card designs, select a card design. Card designs specify the information displayed on extension, agent, and employee monitors.
- Click OK.
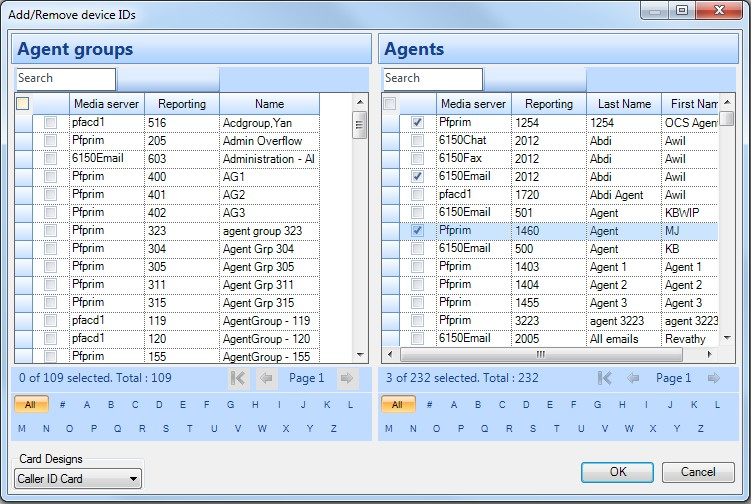
Figure 36: Add/Remove devices
Docking monitors
You can dock monitors and readily navigate between them. You can dock a monitor to the top, bottom, left, or right of another monitor. Alternatively, you can dock a monitor on the top, bottom, left, or right side of the Contact Center Client window. You can dock monitors on top of one another, displaying them on overlapping tabbed panels to maximize real estate.
To dock a monitor on top of another monitor
- Right-click the title bar of an open monitor and select Dock.
- Repeat step 1 for all open monitors.
- Click the title bar of a monitor and drag the monitor on top of a second monitor placing your cursor in the center of the four-headed arrow that displays. See Figure 37.
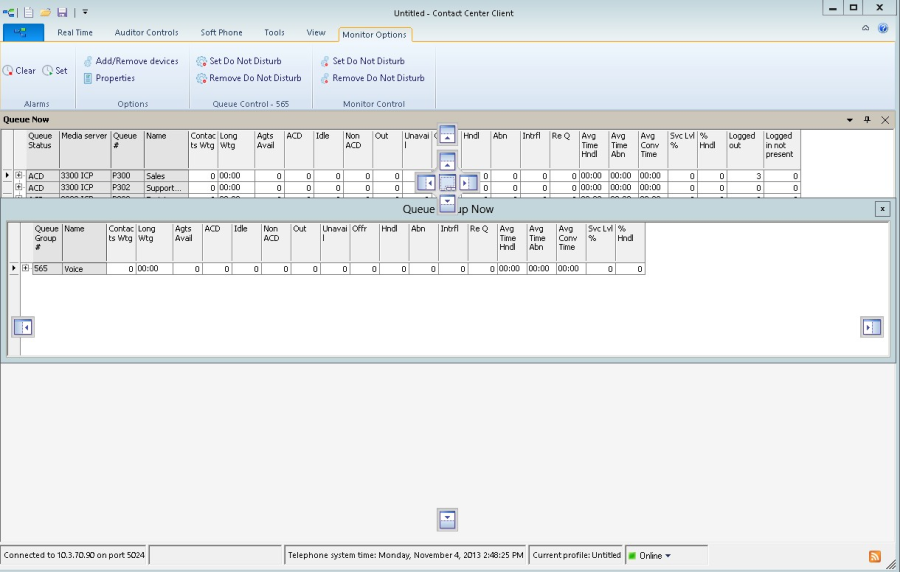
Figure 37: Docking monitors
4. Release the mouse button.
Your monitors are displayed on overlapping tabbed panels. See Figure 38.
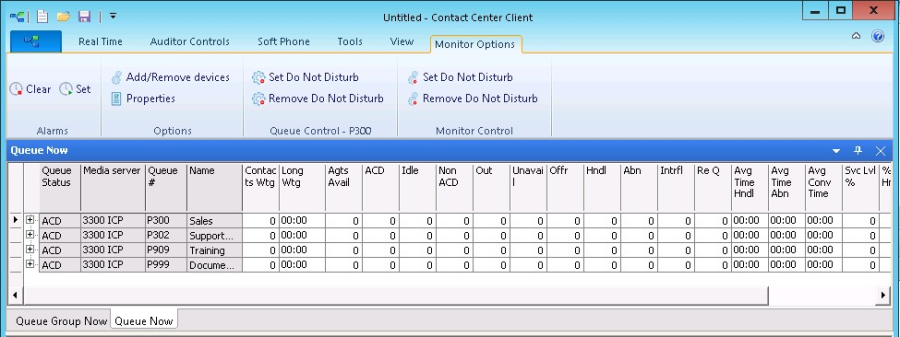
Figure 38: Docked monitor
Adding and removing devices
You can add and remove devices from all of the Contact Center Client monitors except for the chart monitors.
To add devices to the bottom of a monitor
- Right-click an open monitor and click Add/Remove devices.
- Under Agent/Employee/Queue groups, select additional agent, employee, or queue groups to add to the monitor, or under Agents/Employees/Queues, select additional agents, employees, or queues to add to the monitor.
- Click OK.
On the State by Position monitors a blank row of cells separates the original agents from those you just added. To remove the blank row you must sort the monitor.
- Right-click an open monitor and click Add/Remove devices.
- Under Agents/Employees/Queues, clear the check boxes of the agents, employees, or queues to be removed.
- Click OK.
NOTE: You can alternatively add and remove devices via the Monitor Options tab in the Contact Center Client ribbon for the Queue by Period, Queue Now, and Queue Group Now monitors.
Sorting monitor devices
When you select devices to display on a monitor, you can specify the devices be sorted by media server (on agent monitors only), ID, or name (alphabetically) in ascending or descending order. When the monitor opens, the devices display in the order you selected.
To sort the devices displayed on a monitor
- In the left pane of the Add/Remove devices window, click Media server to sort the members by media server, click Name to sort the members alphabetically, or click Reporting to sort the members by ID, in either ascending or descending order. You can sort information by state, name, agent ID, or extension on the State by Position monitors. To sort agents or employees by state, Right-click a monitor and click Sort monitor=>By state.
If you sort agents by state, Contact Center Client displays the agents by state and time in state across the monitor in the following order:
- Ringing
- ACD
- ACD Hold
- Idle
- Non ACD
- Non ACD Hold
- Outbound
- Outbound Hold
- Do Not Disturb
- Make Busy
- System Make Busy
- Work Timer
- Unknown
- Logged Off
To sort agents or employees by name
- Right-click a monitor and click Sort monitor=>By name.
To sort agents or employees by agent ID
- Right-click a monitor and click Sort monitor=>By agent ID.
To sort agents or employees by extension
- Right-click a monitor and click Sort monitor=>By extension.
Rearranging cells
You can rearrange cells on the State by Position monitors.
To rearrange cells
- On an open monitor, drag a cell to a different position on the monitor.
You can rearrange columns on the Agent Shift, Queue by Period, Queue Now, and Queue Group
Now monitors.
To rearrange columns
- Right-click an open monitor and click Properties.
- Click the Layout folder.
- Click Column order.
- Click a column header and click the up or down arrow key to change the position of the column relative to other columns on the monitor.
NOTE: You can alternatively rearrange cells via the Monitor Options tab in the Contact Center Client ribbon for the Queue by Period, Queue Now, and Queue Group Now monitors.
Setting monitor dimensions
You can specify the numbers of rows and columns of cells to display on the State by Position monitors.
To set table dimensions
- Right-click a monitor and click Set table dimensions.
- After Columns, type a number.
- After Rows, type a number.
- Click OK.
Columns or rows are added or deleted from the monitor. You can redistribute the cells using a drag-and-drop operation.
To size the table to fit the frame
- Right-click in any real-time monitor and select Size table to frame.
Hiding monitor columns
On the Agent Shift, Queue by Period, Queue Now, and Queue Group Now monitors, you can hide specific columns of statistics.
To hide columns
- Right-click an open monitor and click Properties.
- Click the Layout folder.
- Click Column order.
- In the Visible column, clear the check boxes of the columns you want to hide from view.
NOTE: You can alternatively hide monitor columns via the Monitor Options tab in the Contact Center
Client ribbon for the Queue by Period, Queue Now, and Queue Group Now monitors.
Filtering device variables
On the Queue Now, Agent Shift, Queue by Period, and Queue Group Now monitors, you can filter specific device variables. For example, on the Queue by Period monitor, you could filter the Calls Offered variable and display statistics for the intervals during which the queue was offered five or more calls.
To filter variables
- Right-click a monitor and click Filter device variables.
- Click Filter data to show, select a variable, select an operand, and type a number.
- Click OK.
A subset of the data is displayed based on the conditions defined in the filter.
Configuring chart characteristics
Individual charts have a range of configurable characteristics and options that enable users to customize their chart display.
You can right-click charts to access the following options or select them via the Chart Options tab:
- Change the chart types
- Configure the legend
- Configure the color scheme
- Define queue chart properties
- Enable points labels
- Modify Properties
Changing chart type
Contact Center Client enables you to configure the type of chart, either column or line, used for your Queue and Queue Group Performance by Period charts. Queue and Queue Group Now charts display as bar charts.
- Right-click on an open By Period chart and click Chart Type.
- Select the type of chart you want your chart to display.
NOTE: Alternatively, you can change the chart type by selecting an open By Period chart, and choosing Column or Line from the drop-down list beside Type in the Chart Options tab.
Configuring the legend
You can choose if your chart has a legend, as well as configure where the legend displays. To configure the legend
- Right-click on an open queue chart and click Legend box.
- Select or deselect Enabled to either display or remove the legend.
- Right-click on an open queue chart and click Legend box.
- Click Left, Top, Right, or Bottom to determine where you want the legend box to display.
NOTE: Alternatively, you can configure the legend by selecting an open queue monitor and accessing options from the Legend section of the Chart Options ribbon.
Configuring the color scheme
You can select the color scheme for the chart. To configure the color scheme for a chart
- Right-click on an open queue chart and click Color.
- Select the color scheme you want to apply to the chart from the list.
NOTE: Alternatively, you can configure the color scheme by selecting an open queue chart and selecting color options from the drop-down list beside Color in the Chart Options ribbon.
Defining queue chart properties
Under Chart properties, you can select general chart characteristics, such as colors and stacked effects. You can define series characteristics, such as the type of chart, the fill properties, and the shape of the bars. In addition, you can define y axis characteristics.
To define queue chart properties
- Right-click an open queue monitor and click Chart properties.
- On the General tab, specify general chart characteristics (colors, effects, and 30).
- Click the Series tab.
- Specify series characteristics (chart style, fill style, bar type, and border style).
- Click the Y Axis tab.
- Specify axis scale characteristics, label characteristics, and the width and color of the axis line.
- Click OK.
NOTE: Alternatively, you can configure queue chart properties by selecting an open queue monitor and clicking Properties located in the Chart Options ribbon.
Enabling point labels
You can enable labels for each point in your chart. To enable point labels
- Right-click on an open queue chart and click Points labels.
NOTE: Alternatively, you can enable point labels by selecting an open queue chart and clicking
Enabled in the Points Label section of the Chart Options ribbon.
Modifying Properties
Properties controls the way chart data displays. Under Properties, you can
- Specify the queue chart title
- Highlight statistics
- Configure 20 and 30 displays
- Animate charts
- Select call statistics to display
- Create and modify Constant lines
NOTE: You can either right-click an open queue chart to modify properties or select an open queue chart and choose options via the Properties section of the Chart Options tab.
Specifying the queue chart title
Under Properties, you can specify the title of the queue chart. To specify the queue chart title
- Right-click on an open queue chart and click Properties.
- After Monitor title, select and delete the old chart title and type a new name for the queue chart.
- Click OK.
Highlighting statistics
Under Properties, you can enable the highlight feature. When the highlight feature is enabled, and when you move your cursor over a bar representing a specific call statistic, that bar is highlighted and the other bars, representing other call statistics, are dimmed.
To highlight statistics
- Right-click on an open queue chart and click Properties.
- Expand the Chart properties tree and click General.
- Select the Highlight check box.
- Click OK.
Configuring 2D or 3D chart displays
Under Properties, you can configure whether your chart displays bars in 2D or 3D. By default, your charts display in 3D.
- Right-click on an open queue chart and click Properties.
- Expand the Chart properties tree and click General.
- Select the 3D check box to enable or disable 3D charts.
- Click OK.
Animating charts
Under Properties, you can enable the animated feature. When the animated feature is enabled, changes to chart values actively display. The animated feature is disabled by default.
CAUTION: Enabling the animated feature will result in additional CPU load on the affected workstation.
To animate charts
- Right-click on an open queue chart and click Properties.
- Expand the Chart properties tree and click General.
- Select the Animated check box.
- Click OK.
Selecting call statistics to display
Under Properties, you can select call statistics to display. For example, you can add Calls Waiting, Agents Available, Idle, and Requeued statistics to the Queue Group Now (Integer) chart.
To select call statistics to display
- Right-click on an open queue chart and click Properties.
- Expand the Chart properties tree and click Series data.
- Select the Series data type radio button to define the types of data visible in the chart.
- Integer
- Percentage
- Time
- If you are selecting call statistics for a Queue or Queue Group Performance by Period chart, click Time Interval. Select the radio button for the interval you want to use and set the time.
- Under Visible, select the check box of the data you want to add to the chart.
- Alternatively, under Visible, clear the check box of the data you want to remove from the chart.
- Click OK.
Creating and modifying Constant lines
Under Properties, you can configure Constant lines. Constant lines are horizontal lines you configure to display across your chart at set values on the Y-axis, enabling you to clearly see how the data being displayed in the chart meets with desired values.
To create Constant lines
- Right-click on an open queue chart and click Properties.
- Click Chart properties.
- Click Constant lines.
- Click Add.
- Click in the Color box to choose a color. NOTE: The default constant line color is red.
- After Text, type the name you want to display beside the constant line in the chart.
- After Value, type the value you want the constant line to mark.
- After Width, select the thickness of the line.
- Click OK.
The Constant line will be added to the list of active Constant lines. To modify a Constant line
- Select the Constant line you want to modify and click Edit.
- After Text, type the name you want to display beside the Constant line in the chart.
- After Value, type the value you want the Constant line to mark.
- After Width, select the thickness of the line.
- Click OK.
To delete a Constant line
- Select the Constant line you want to delete and click Delete.
SETTING ALARMS
You can define alarms to alert you to significant changes in contact center activity. Using the alarms, you specify performance thresholds for contact center elements, such as queues and agents, and customize the visual, auditory, or email delivery of alarms. If any availability or performance issues arise, your alarms deliver a notification enabling you to instantly change agent and queue availability to adjust to unplanned call volumes.
Client alarms are specific to each computer. To notify you that performance thresholds are not being met, you can configure alarms so that
- Monitor cells and statistics change color.
- A pop-up notification opens on your desktop.
- A sound prompt, such as a beep or .wav file, plays.
- You are notified by email.
- Contact Center Client opens on top of all open applications.
To configure alarms for real-time monitors
- Add performance thresholds.
- Specify threshold colors.
- Specify threshold notification.
Adding performance thresholds
To add performance thresholds so you can monitor alarms
- Right-click a monitor and click Set alarms. Alternatively, select an open monitor and click Set alarms in the Alarms column, found in the Monitor or Chart Options tab in the Contact Center Client ribbon. The Set alarms window opens. NOTE: You can select the Apply the alarm thresholds to all devices displayed on the monitor check box to apply the threshold settings for performance variables across all queues or agents. Alternatively, you can select Apply the alarm thresholds to a specific list of devices to apply the threshold settings for a performance variable to a list of queues or agents.
2. Under Devices, select one or more queues or agents or select the Select all check box to select all queues or agents.
3. In the Performance variables list, select a variable.
4. Under Alarm Thresholds, click Add threshold and type a value for the upper boundary of the threshold. The lower boundary cannot be modified.
The lower boundary of the next threshold is always slightly greater than the upper boundary of the previous threshold.
5. Click OK.
Specifying performance threshold colors
To configure performance threshold colors
- For the alarm threshold for which you want to specify colors, under Background, click the arrow. A color palate opens.
- Select a color.
- Under Font color, click the arrow. A color palate opens.
- Select the font color for the alarm threshold.
- Click OK.
Specifying threshold notification
To configure performance threshold sound notification
- For the alarm threshold for which you want to be notified by a sound, under Sound, select the check box. The Sound window opens.
- Specify the alarm triggering properties.
- Specify the sound you want played when the alarm is triggered.
- Click Save.
To configure performance threshold pop-up window notification
- For the alarm threshold for which you want to be notified by a pop-up window, under Pop-up, select the check box. The Pop-up window opens.
- After Duration, type the number of seconds you want the pop-up alarm to be displayed when threshold conditions are satisfied.
- If you want to display the pop-up alarm on top of all of the other applications, select the Keep this message visible on mouse over check box.
- Optionally, click the Format font button to specify font attributes for the pop-up alarm message.
- In the text box, type the message for the performance threshold and click the Add variable button to insert performance variables. (for example, type CW P001 = <calls waiting variable>).
- Click Save.
To specify that Contact Center Client opens on top of all other applications when a performance threshold is satisfied
- For the alarm threshold for which you want to be notified, under Bring to front, select the check box.
To configure performance threshold email notification
- For the alarm threshold for which you want to be notified, or notify others by email, under Email, select the check box. The Email window opens.
- After Distribution, specify which contacts are to be notified by email when threshold conditions are satisfied.
- After Subject, type the subject of the email to be sent (for example, type Calls Wtg in Sales Queue 1 >1O!).
- In the message box, type the body of the email.
- Click Save.
Consider the threshold programming in Figure 39. When the number of agents available in the technical support queue is between O and 2, the cell housing the Agents Available statistic is red. When the number of agents available is between 3 and 4, the cell turns orange. When the number of agents available is 5 or greater, the cell turns white. In addition, audible alarms and pop-up alarms display.
To clear any current client alarms in Contact Center Client
- Right-click the monitor and click Clear alarms.
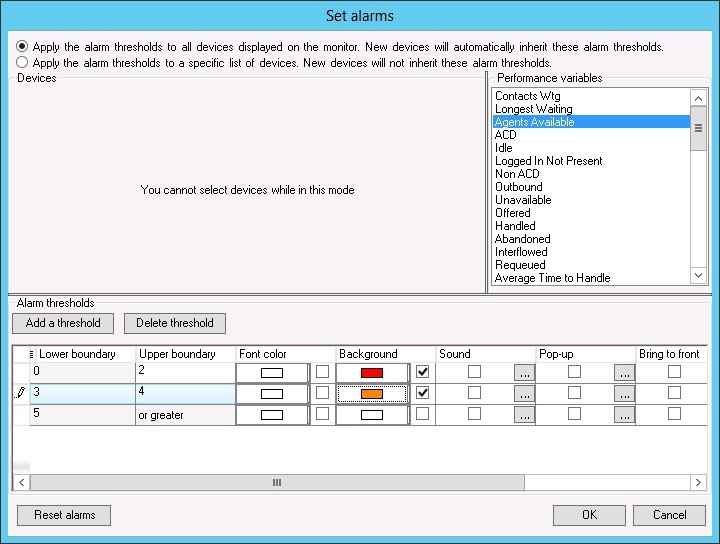
Figure 39: Set alarms window
CUSTOMIZING THE INFORMATION DISPLAYED ON POSITION AND TIME MONITORS
On the agent, employee, and extension by position and by time monitors, real-time information is displayed in cells (cards). You can select from available card designs, or customize cards to display specific information.
When you first open an agent, employee, and extension monitor, you can select a card design on the Add/Remove device IDs window:
- The Classic card displays the agent state, time in the state, presence, agent/employee name, agent login ID/employee ID, and extension number (or queue name for voice agents on ACD or on ACD Hold).
- The Caller ID card displays the caller name and number (ANI), the number the caller/employee dials for incoming/outgoing calls, the state, time in the state, presence, agent/employee name, agent login ID/employee ID, and extension number (or queue name for voice agents on ACD or on ACD Hold.
- Custom cards you create and share
The Caller ID card is the default card design. You can use this card design, or select the Classic card or a customized card. You can create new card designs or copy existing card designs and modify them. For example, you can add or remove text and variables from cards and rearrange the information displayed. You can share card designs with other employees. When you select a card design for an agent, employee, or extension monitor, it is applied to all monitors of that type.
Selecting and customizing card designs
To select a card design
- Right-click an open position or time monitor and click Properties.
- Click Layout=>Card design.
- Under Design name, select a card design.
- Click OK.
To customize cards for position and time monitors
- Under Card design,
- If you want to create a card design, click New.
- If you want to edit an existing card design, select a card design and click Edit.
- If you want to create a card design based on the Caller ID card or the Classic card, select either card and click Copy.
- On the New card design window, type the name of the new card design.
- If you want to share the design with other agents, select Share design.
- Click OK.
- Select the card and click Edit. See Figure 40.
- After State, select a state for the card design. You can use the same card design for all states or you can customize cards for specific states, such as ACD, Idle, Make Busy, and Unknown.
- Under Fields, select a field type and drag and drop it to the card design.
- If you want to resize the field, click the field and use your pointer to move or resize the field.
- If you want to change the properties for a field, click the field and change the properties in the right pane of Card Designer.
- If you want to change the size of the card design preview, after Zoom, select a different magnification value from the list.
- Add additional fields to the card.
- Select Copy to if you want to copy the current design to the card of a different state.
- Click OK. The new card design displays on the Card design list.
- Click OK.
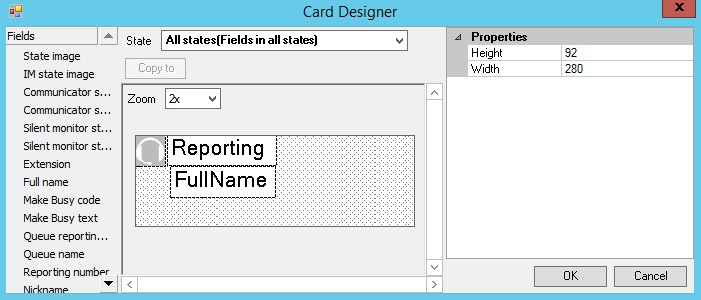
Figure 40: Card Designer window
Defining monitor styles
You can customize the appearance of individual monitor elements. For example, you can configure the font size and color of column headings or apply a skin of predefined colors and font attributes to the entire monitor.
To customize the appearance of monitor elements
- Right-click an open monitor and click Properties.
- Click General=>General settings.
- If you want to change the title of the monitor, after Title, type a name.
- If you want to scroll horizontally on the monitor, select the Enable horizontal scroll bars check box.
- If you want to scroll vertically on the monitor, select the Enable vertical scroll bars check box.
- If you want to group monitor headings, select the Enable grouping check box.
- If you want to apply a skin to the monitor, click Layout=>Monitor style.
- Click Load style and select a skin.
- Otherwise, under Properties, manually configure the column settings, column font, row settings, and row-alternate settings.
- Click OK.
Adding text to card designs
You can use a text box to add custom text to a card. To edit text that you have added to a card
- Select the text box. Properties displays on the right.
- Under Properties, in the box to the right of Text, type the text to be added to the card.
- Click OK.
- Click OK.
Grouping data
You can group rows of data in the Queue Now monitor, and other monitors that contain columns. For example, you can group the data by the ACD count statistic and readily see which agents handled the most calls, and which agents handled the least calls, as illustrated in Figure 41.
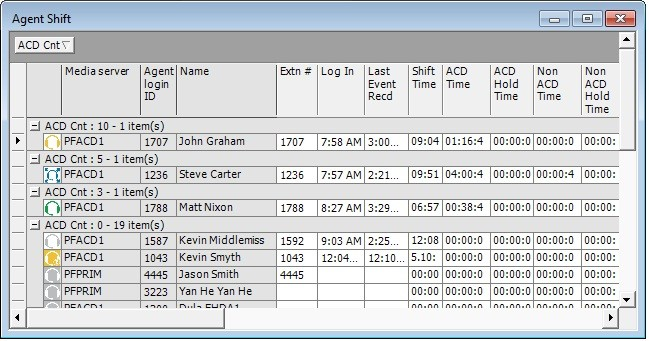
Figure 41: Enable grouping
The Enable grouping option displays a grouping panel to which users drag columns. The grouping order determines the order in which the rows display.
To enable grouping
- Right-click an open monitor and click Properties.
- Select the Enable grouping check box.
- Click OK. The monitor displays a grouping panel.
- Drag a column heading to the panel to group by the column heading.
BUILDING MARQUEE MONITORS
You can build marquee monitors to broadcast real-time statistics and messages and alarm on real- time contact center performance statistics. With marquee monitors and wall-mounted marquee displays, such as LCD monitors or LED reader boards, you can offer your supervisors and agents access to important contact center performance metrics.
To build a marquee monitor, you must
- Specify styles for the marquee monitor.
- Configure marquee text and variables.
Configuring marquee monitor styles
To specify attributes for the marquee background
- Click the Marquee icon. The Configure marquee window opens.
- Click Add a message. The Add a message window opens.
- Type a name for the message.
- Under Position, select Top, Right, Left, Center, or Bottom to specify how the message is to be displayed on the marquee.
- Click Format marquee. The Format marquee window opens.
- After Background color, select a color for the background.
- After Cell color, select a color for the marquee cells.
- After Cell size, specify a value for the size of the marquee cells.
- After Cell spacing, select a value for the space between marquee cells.
- To specify the marquee text font type and color, click Format font. The Font window opens.
- Select font attributes.
- Click OK.
- If you want the message and the background of the message to be displayed using pixels, select the Matrix style check box.
- Click OK.
- Click OK. The marquee displays. NOTE: You must configure marquee text and variables.
Configuring marquee text and variables
To configure text and variables for the marquee
- Right-click the marquee and click Configure marquee. The Configure marquee window opens.
- In the Message editor text box, type a message to display on the marquee (for example, type Calls Wtg =).
- Under Message editor, click the Add variable button. The Add/Edit variable window displays.
- Click Add. The Configure variable window opens.
- Under Variable types, click the monitor type to which the variable applies.
- Under Variables, click a variable. NOTE: The following queue variables will not supply information for Ring Groups:
- • % Handled by 1, 2, 3, 4
- • Dial Out of queue
- • Requeued
- Under Devices, select the check box of a device.
- Under Thresholds, click Add threshold and specify a value for the upper boundary of the first threshold.
- Click OK.
- For the threshold, under Variable, select a color to be displayed in the marquee message string.
- For the threshold, under Message, select a color for the text that will precede the variable in the marquee text string.
- After Type a name for the variable, type a name.
- Click OK.
- On the Configure marquee window, in the Message editor text box, position your pointer where you want to add the variable.
- You can add variables at the beginning, middle, or end of message strings.
- On the Add/Edit variable window, double-click the variable to add it to the message string. Click the Add variable button. The Add/Edit variable window opens.
- Click the Configure transition effects button and select the check boxes for the transition effects to be included.
- Click OK.
The marquee displays, showing the text you typed and a real-time value for the performance variable. You can define additional thresholds for the performance variable, and add additional variables to the marquee.
USING CONTACT CENTER CHAT
Contact Center Client provides instant messaging capabilities for both supervisors and agents and is typically used by contact center employees only. Contact Center Chat provides the online chat presence of contact center employees, including Online, Offline, and Away. Agents can view the availability and presence of other contact center employees before they transfer calls or send online chat messages.
Using Contact Center Chat, you can communicate essential information to one or more agents, agent groups, or supervisors quickly and securely. You can coach agents and send timely messages, such as asking an agent to delay going on break when it is busy.
NOTE:
- You must have a security role that does not restrict you from gaining access to Contact Center Chat.
- You must log on to Contact Center Client in order to send and receive online messages.
- When you receive a message it is displayed immediately on top of all open windows.
Sending a Contact Center Chat message
On an extension, agent, or employee monitor you can right-click an agent's cell and click Send instant message to send an online message to the agent.
To send a chat message
- Double-click your presence indicator in Contact Center Client's Status Bar.
Contact Center Chat opens. (See Figure 42.)
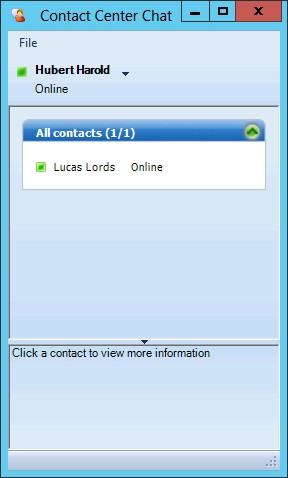
Figure 42: Contact Center Chat
2. Right-click a contact and select Send an instant message. Alternatively, double-click the contact. The Conversation window opens.
3. Type a message.
4. Click Send.
To send a chat message while viewing an extension, agent, or employee monitor
- Right-click a cell in an open monitor and click Send instant message. Alternatively, double- click the presence indicator in the extension, agent, or employee's cell in the monitor. The Conversation window displays.
- Type a message.
- Click Send.
Adding someone to a conversation
To add someone to a conversation
- On the Conversation window, click the Add Participants button to join this conversation icon.
- Double-click a contact to add the contact to the conversation.
- Click Send.
Responding to a Contact Center Chat message
Agents and supervisors can receive Contact Center Chat messages only if they are logged on to Contact Center Client. When someone sends a Contact Center Chat message to you, the Conversation window opens and a desktop notification appears in the bottom-right of your monitor. The desktop notification shows the name and presence of the employee contacting you and their message. Figure 43 illustrates a chat notification.
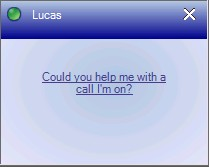
Figure 43: Desktop Chat notification
To respond to a chat message
- Type a message.
- Click Send.
Contact Center Chat sends your response to all chat session participants.
USING CONTACT CENTER CHAT WITH SKYPE FOR BUSINESS
With the addition of Microsoft Skype for Business Server agents and supervisors use Skype for Business as their default instant messaging client. The presence of all company employees is natively delivered in Contact Center Client. Contact center employees can view the presence of both internal and external contacts to determine if they are available to communicate. In addition to Available, Offline, and Away, employees see In a Meeting, Busy, In a call, Do Not Disturb, Be Right Back, and other Skype for Business presence indicators.
NOTE: In order to use Contact Center Chat with Skype for Business, you must enable Contact Center Chat and have Skype for Business open and running.
If an agent views an employee on a real-time monitor and notes the employee is online, the agent can right-click the employee and send an instant message.
Table 15 provides details on the presence indicators that are available when Contact Center Client is used in conjunction with Skype for Business Client and Contact Center Chat with Skype for Business.
Table 15: Skype for Business presence indicator icons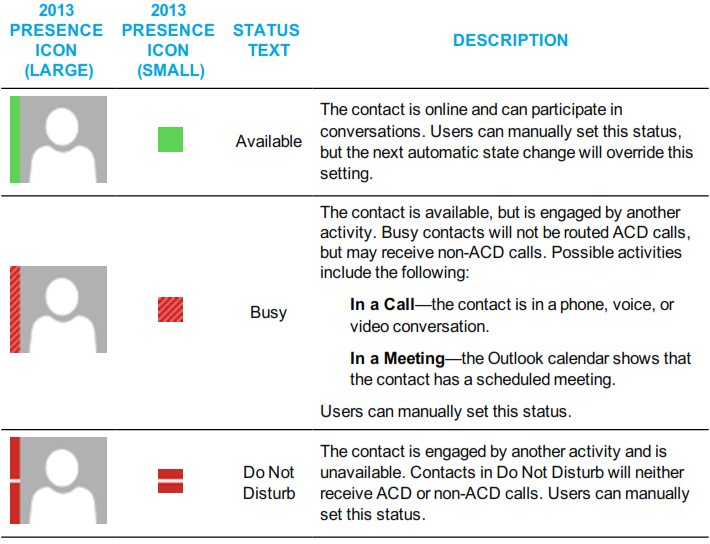
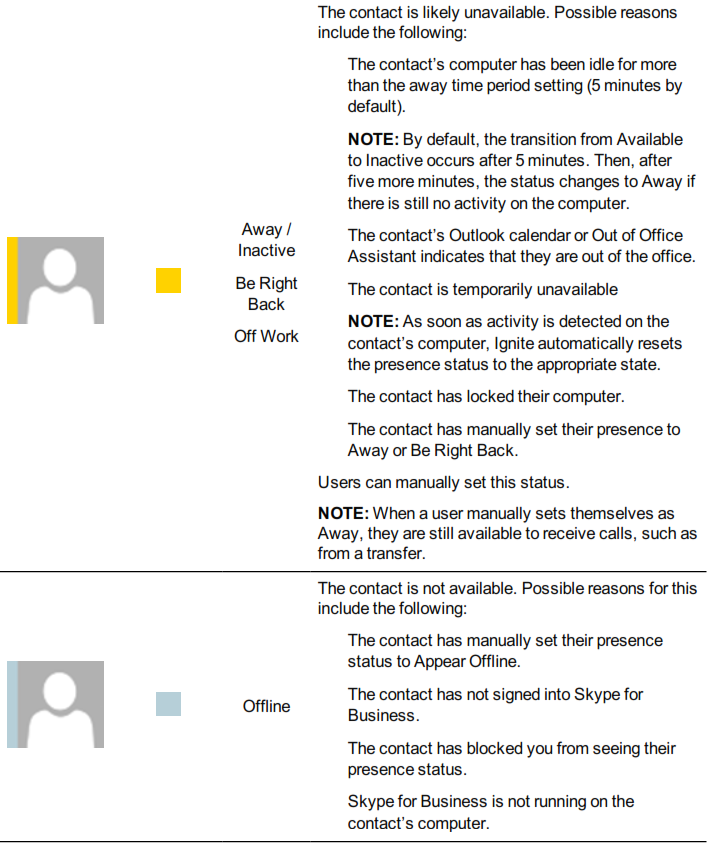
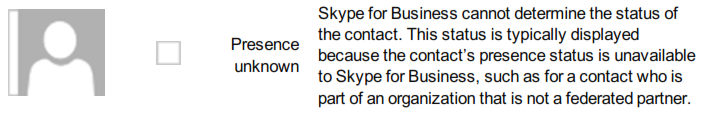
Sending an instant message
On an agent or employee monitor, you can right-click an agent or employee's cell and click Send instant message to send an online message to the agent or employee. You can also send instant messages using Microsoft Skype for Business. Using Skype for Business, you can send instant messages to individuals or multiple contacts. After initiating a conversation, you can invite additional contacts to the conversation. For instruction in using Skype for Business, consult your Microsoft Skype for Business documentation.
NOTE: Supervisors send instant messages to contacts or groups of contacts using Contact Center Client.
To send an instant message while viewing agents on an extension, agent, or employee monitor
- Right-click a cell in an open monitor and click Send instant message.
A Skype for Business Conversation window opens.
HOT DESKING PROFILE SETTINGS
When an agent is configured as a Mitel hot desking agent, the agent can sit at any extension on the network and log on to the extension. After the agent is logged on, the agent takes control of the extension. The agent's Contact Center Client and soft phone real-time profile settings are available. Any previous associations with the extension are taken out of service. When an agent logs off, the agent disconnects from the extension and the default settings for the extension are restored automatically.
WARNING: If an external hot desk agent is using a personal phone to handle calls, incoming calls that are not answered could reach their personal voicemail.
POSTING FEEDBACK AND VIEWING OUR FORUMS
Mitel has partnered with UserVoice, a third-party service, to host customer suggestions on https://micontactcenter.uservoice.com. When you post an idea to our feedback forum, others will be able to subscribe to it and make comments.
Our forums enable you to send feedback directly to the people building the product. While we cannot comment on every suggestion, feedback is analyzed and considered for future releases.
NOTE: Please do not use the forums to submit product defects. To submit product defects, please contact your administrator or dealer.
Feedback can also be submitted directly to Mitel without posting the suggestion on the forums. For more general feedback, you can also provide a rating of your experience with MiContact Center.
NOTE: Please do not use feedback for requesting customer assistance. For assistance with MiContact Center, please contact UniVoIP Support. To post feedback and view our forums
- Click File=>Feedback.
- Click Got an idea? Tell us.
OR
Access the following URL: *https://micontactcenter.uservoice.com.*
To submit feedback directly
- Click File=>Feedback.
- Click Contact us.
To rate your Mitel experience
- Click File=>Feedback.
- Click Rate us.