The Voice Queues Reports is a line graph showing data as it evolved over time. You can show or hide any of the report elements by clicking on the element title below the graph.
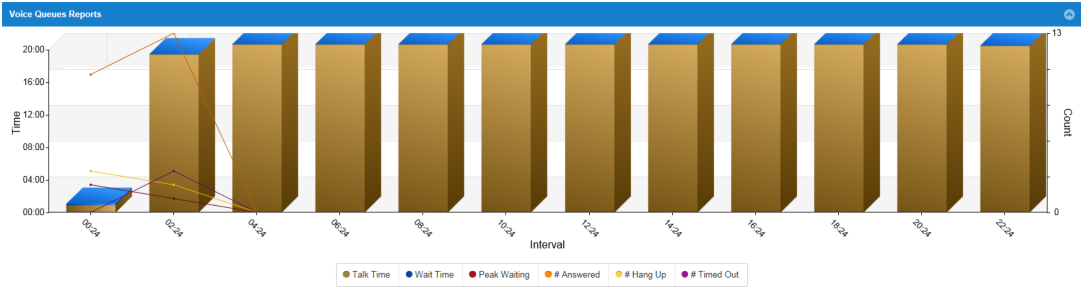
Field Definitions
• Talk Time: the total time callers through this Queue spent talking to agents.
• Wait Time: the total time callers spent waiting in this Queue.
• Peak Waiting: the peak number of callers waiting in this Queue during the report interval.
• # Answered: the number of queued calls answered by Agents in the Queue during the report interval.
• # Hang Up: the number of calls in the queue hung-up by the caller during the report interval.
• # Timed Out: the number of calls in which the caller timed-out waiting in Queue during the report interval.
The time and intervals shown in the X and Y axis of the graph are determined by the settings entered in the Display Reports panel. The interval shown can vary from as short as 15 mins to as long as 1 week depending on the settings used. The start date is midnight of the selected Start Date and the end date is either the selected End Date or the last full aggregation interval in the system.