SMS QUEUE REPORTS
Queue and queue group reports provide statistics on queues and queue groups that reflect SMS behavior and the service experienced by customers who contact you by SMS.
The Queue reports are listed below:
Performance reports
• Queue and Queue Group Performance by Account Code
• Queue Performance by Agent
• Queue and Queue Group Performance by Period
• Queue Group Performance by Queue
Spectrum reports: The spectrum reports provide a frequency distribution of SMS contacts answered or interflowed based on a defined time scale
• Queue and Queue Group Answer Spectrum by Period
• Queue and Queue Group Handle Spectrum by Period
• Queue and Queue Group Interflow Spectrum by Period
• Queue Group Answer Spectrum by Queue
• Queue Group Handle Spectrum by Queue
• Queue Group Interflow Spectrum by Queue
NOTE:
• Multimedia contacts in queue tagged as Junk or No Reply from Interactive Visual Queue and Ignite are not included in queue Handled, Completed, and Offered counts.
• If you are running a report on a queue group that has non-SMS queue members, the statistical values in the generated report will be for SMS queues only.
SMS Queue and Queue Group Performance by Account Code
The SMS Queue and Queue Group Performance by Account Code reports show the SMS performance of a queue or queue group for Account Codes. This report enables supervisors to compare SMS queue and Queue Group performance by Account Code. (See Figure 143.)
The SMS Queue and Queue Group Performance by Account Code reports provides the following information:
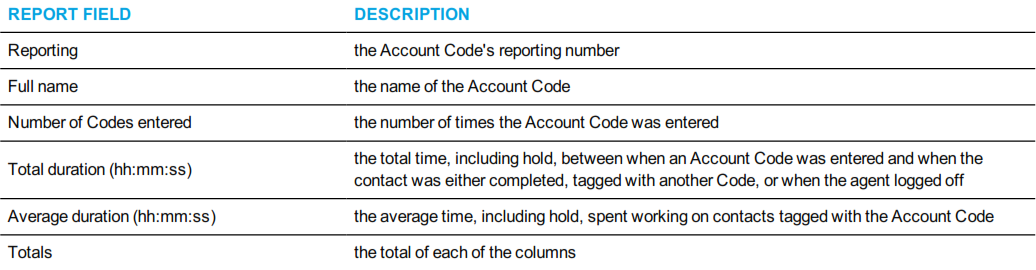
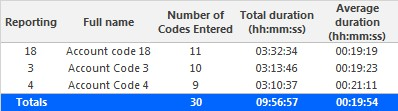
Figure 143: SMS Queue Performance by Account Code
SMS Queue Performance by Agent
The SMS Queue Performance by Agent report shows handling statistics for agents answering contacts for SMS queues. (See Figure 144.)
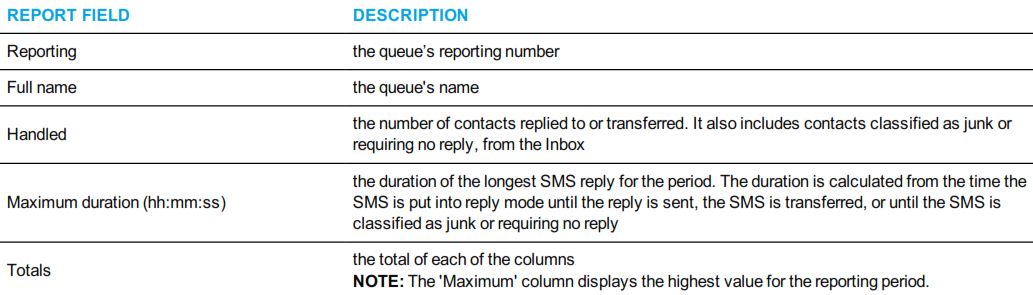
The SMS Queue Performance by Agent report provides the following information:
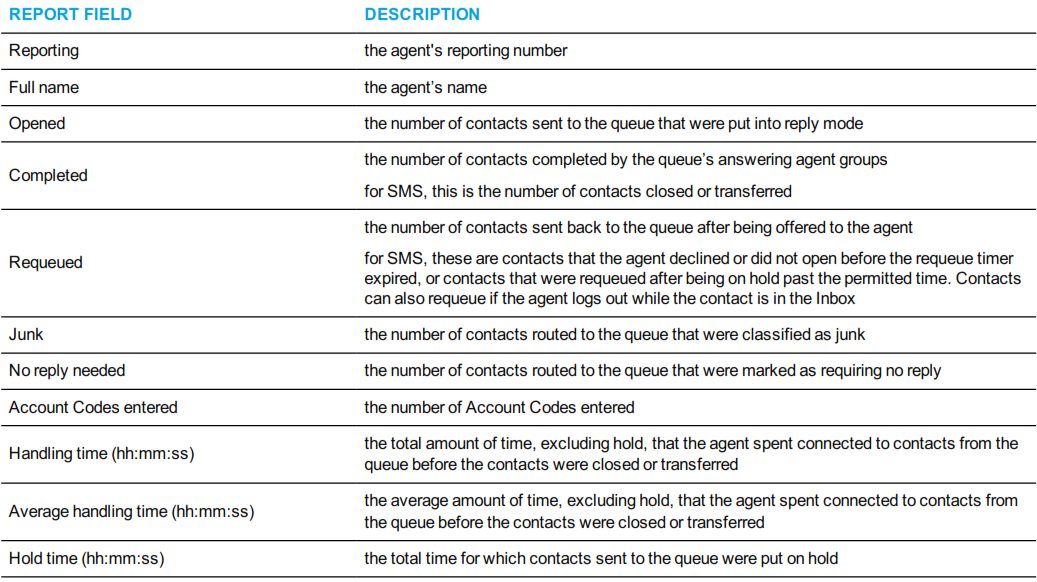
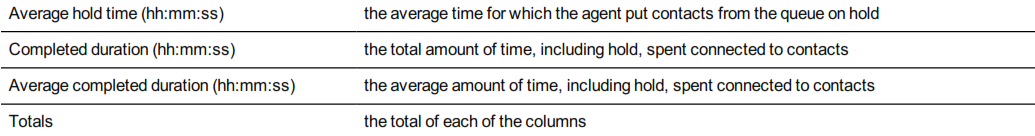
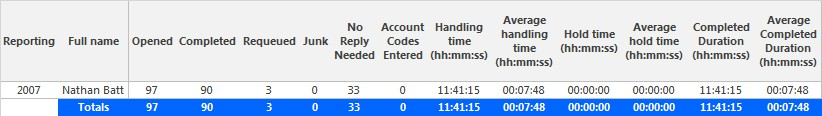
Figure 144: SMS Queue Performance by Agent
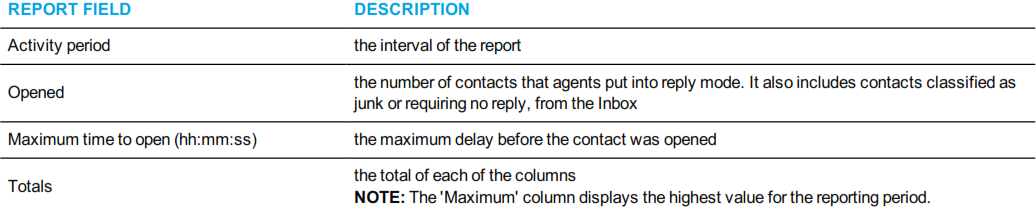
SMS Queue and Queue Group Performance by Period
The SMS Queue and Queue Group Performance by Period reports show the SMS activity of a queue or queue group, across intervals, for the specified period. (See Figure 145.)
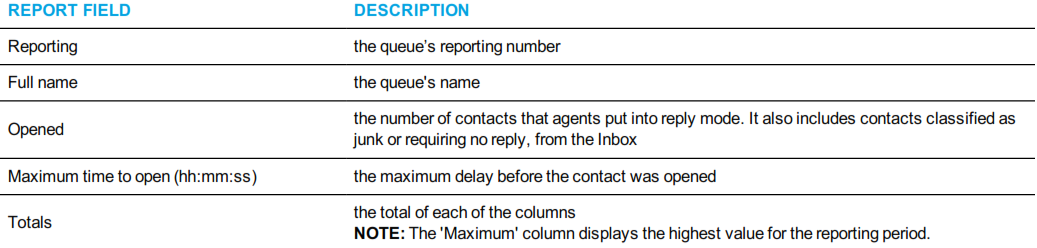
The SMS Queue and Queue Group Performance by Period reports provides the following information:
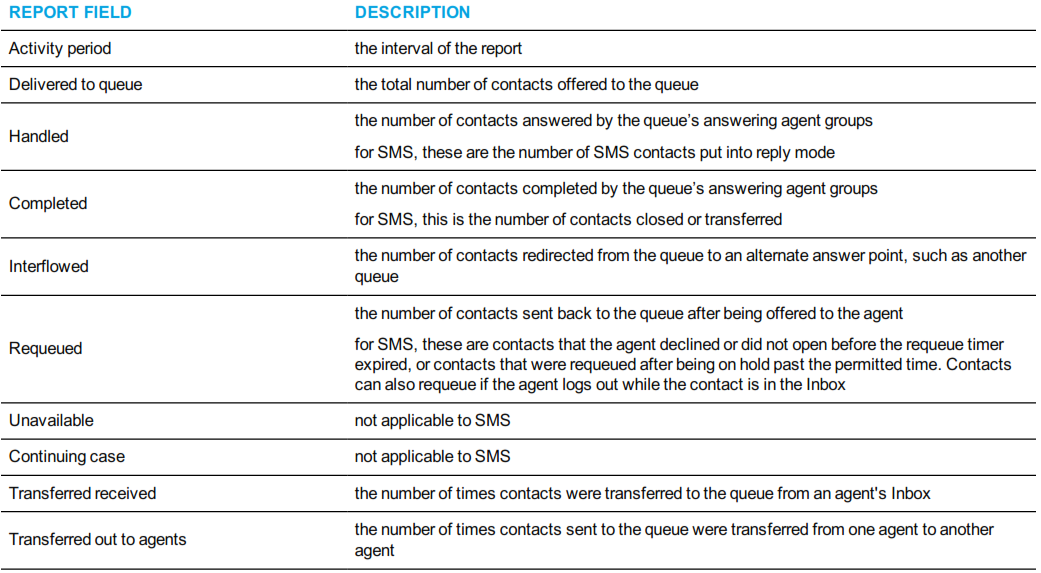
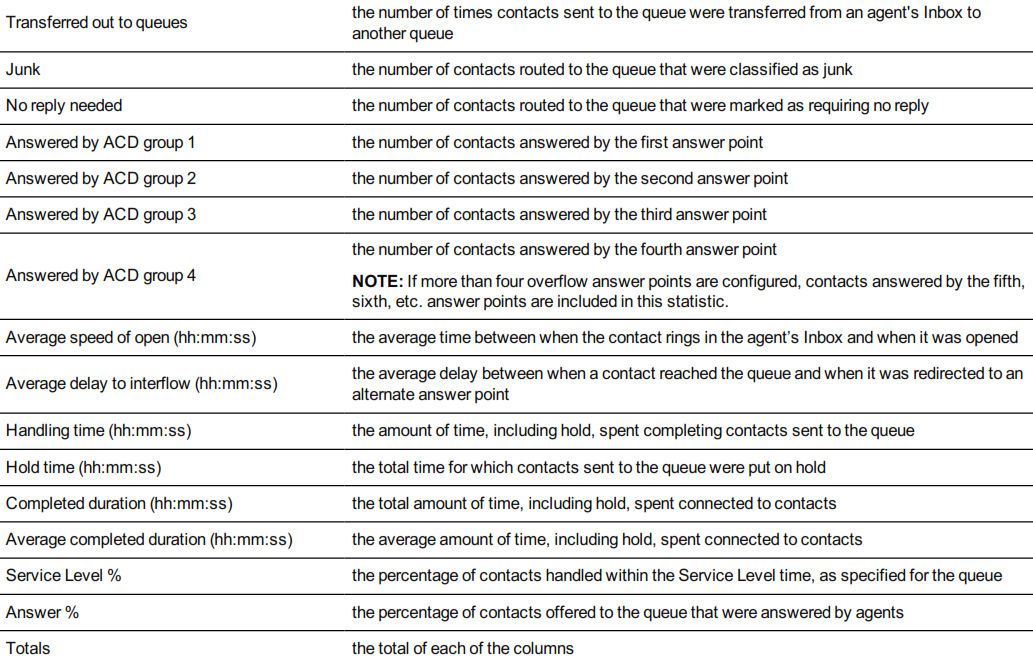
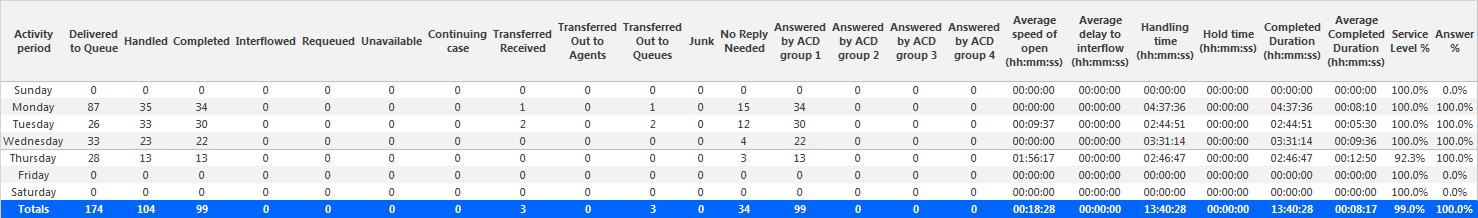
Figure 145: SMS Queue Group Performance by Period
SMS Queue Group Performance by Queue
The SMS Queue Group Performance by Queue report compares the workload distribution across the queues in a queue group for the specified reporting period. It reports the SMS statistics in hours, minutes, and seconds, and provides SMS counts across queues. (See Figure 146.)
The SMS Queue Group Performance by Queue report provides the following information:
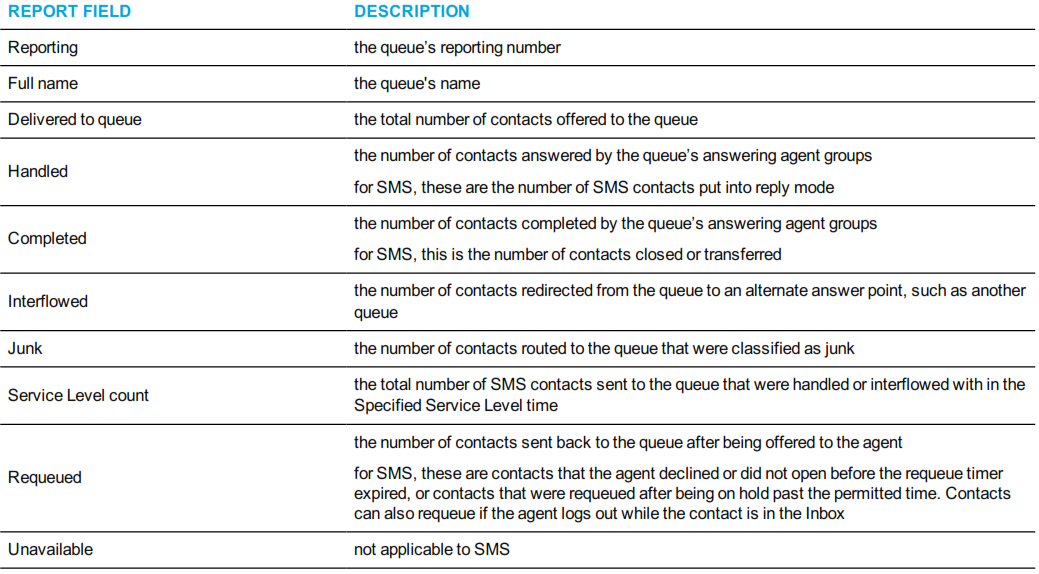
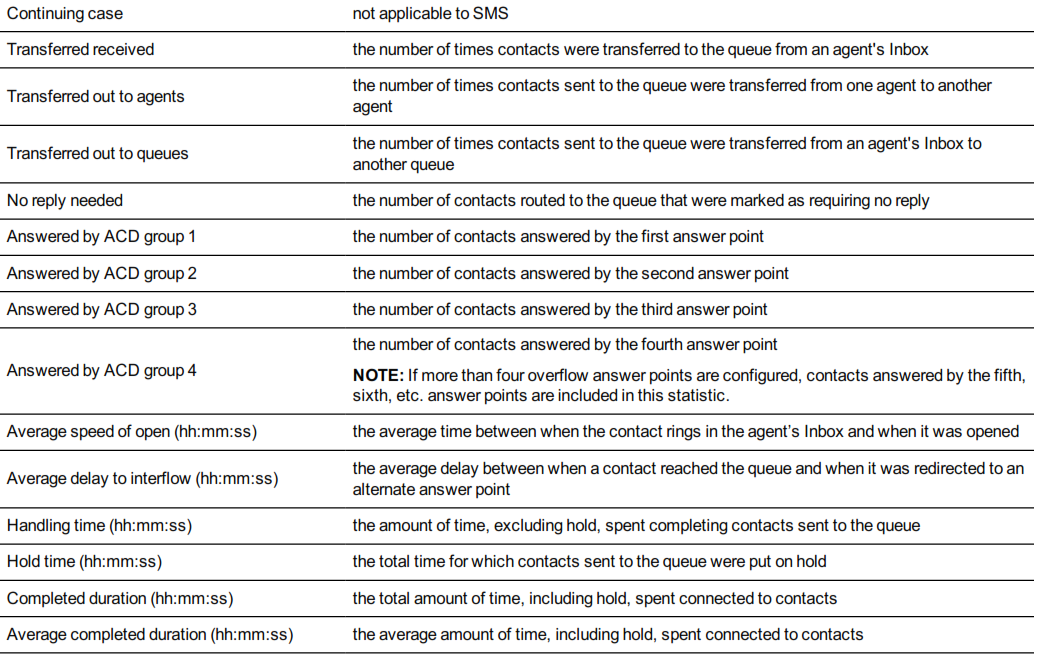

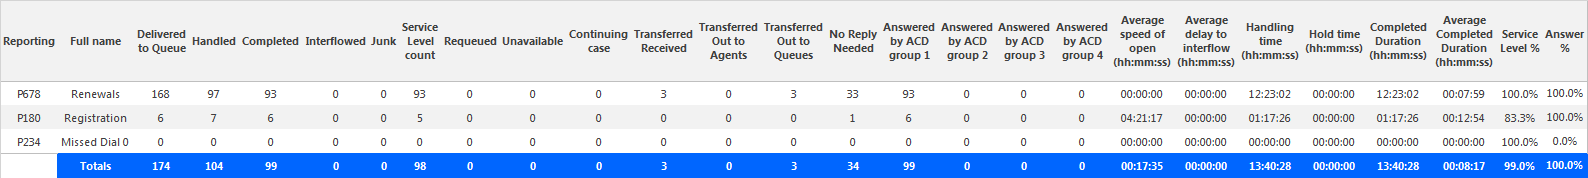
Figure 146: SMS Queue Group Performance by Queue
SMS Queue and Queue Group Answer Spectrum by Period
The SMS Queue and Queue Group Answer Spectrum by Period reports provide a frequency distribution of SMS contacts answered for queues and queue groups, across intervals, for the specified period. (See Figure 147.)
NOTE: 'Day of week', 'Month', and 'Day of month' intervals have been added to the Spectrum by Period reports. Upgrading from Version 6.x to Version 7.x converts Spectrum by Day of Week reports into Spectrum by Period reports, with data displaying by day of week intervals.
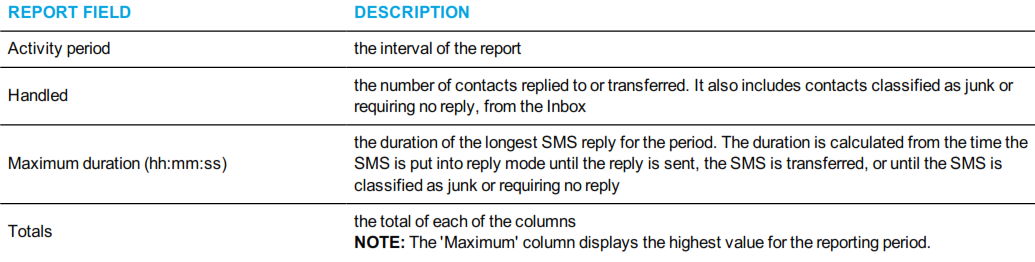
The following are the first three fields of the SMS Queue and Queue Group Answer Spectrum by Period reports:
The remaining fields of the SMS Queue Answer Spectrum by Period report provide a frequency distribution of SMS contact patterns based on the time scale defined for the queue in YourSite Explorer. For each time period, the Count <=X Minutes field reflects the total number of SMS contacts for that interval and all preceding intervals. Queue spectrum values that cannot be rounded to whole minute values will display as decimal values with 2 places in the Count <=X Minutes report fields.
The remaining fields of the SMS Queue Group Answer Spectrum by Period report provide a frequency distribution of SMS patterns based on a defined time scale (Spectral Interval 1-10). The Spectrum Interval field reflects the total number of SMS contacts for that interval and all preceding intervals. The % of contacts opened field reflects the percentage of SMS contacts for that interval and all preceding intervals.
NOTE:
• For each time period, > 120 seconds, the Count < x min field reflects the total number of SMS contacts for that interval and all preceding intervals.
• For the >120 minutes' time period, the Count < x min field reflects the total number of SMS contacts for that interval only.
• The % of Total field reflects the percentage of SMS contacts for that interval and all preceding intervals.
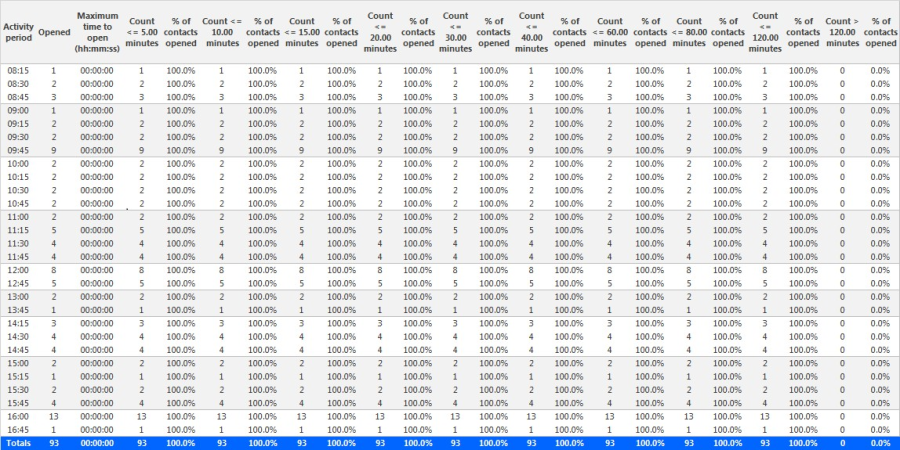
Figure 147: SMS Queue Answer Spectrum by Period
SMS Queue and Queue Group Handle Spectrum by Period
The SMS Queue and Queue Group Handle Spectrum by Period reports provide a frequency distribution of SMS contacts handled for queues and queue groups, across intervals, for the specified period. (See Figure 148.)
NOTE: 'Day of week', 'Month', and 'Day of month' intervals have been added to the Spectrum by Period reports. Upgrading from Version 6.x to Version 7.x converts Spectrum by Day of Week reports into Spectrum by Period reports, with data displaying by day of week intervals.
The following are the first three fields of the SMS Queue and Queue Group Handle Spectrum by Period reports:
The remaining fields of the SMS Queue Handle Spectrum by Period provide a frequency distribution of SMS patterns based on the time scale defined for the queue in YourSite Explorer. For each time period, the Count <=X Minutes field reflects the total number of SMS contacts for that interval and all preceding intervals. Queue spectrum values that cannot be rounded to whole minute values will display as decimal values with 2 places in the Count <=X Minutes report fields.
The remaining fields of the SMS Queue Group Handle Spectrum by Period report provide a frequency distribution of SMS patterns based on a defined time scale (Spectral Interval 1-10). The Spectrum Interval field reflects the total number of SMS contacts for that interval and all preceding intervals. The % of contacts handled field reflects the percentage of SMS contacts for that interval and all preceding intervals.
NOTE:
• For each time period, except <= 541 seconds, the Count <= min field reflects the total number of SMS contacts for that interval and all preceding intervals.
• For the <= 541 minutes' time period, the Count <= min field reflects the total number of SMS contacts for that interval only.
• The % of Total field reflects the percentage of SMS contacts for that interval and all preceding intervals.
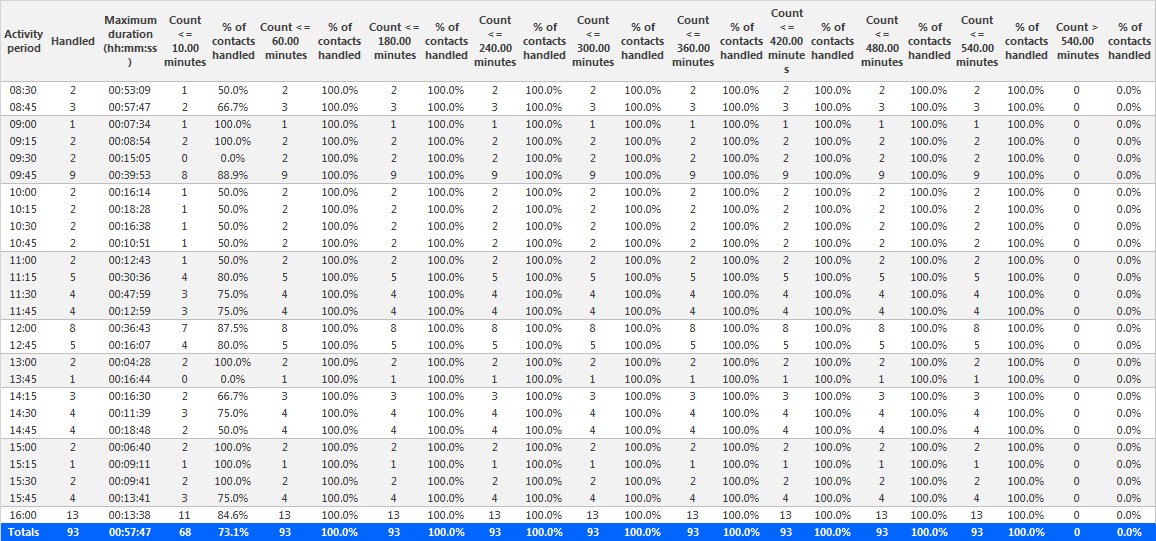
Figure 148: SMS Queue Handle Spectrum by Period
SMS Queue and Queue Group lnterflow Spectrum by Period
The SMS Queue and Queue Group lnterflow Spectrum by Period reports provide a frequency distribution of SMS contacts interflowed across queues and queue groups. The data displays in intervals for the specified period. (See Figure 149.)
NOTE: 'Day of week', 'Month', and 'Day of month' intervals have been added to the Spectrum by Period reports. Upgrading from Version 6.x to Version 7.x converts Spectrum by Day of Week reports into Spectrum by Period reports, with data displaying by day of week intervals.
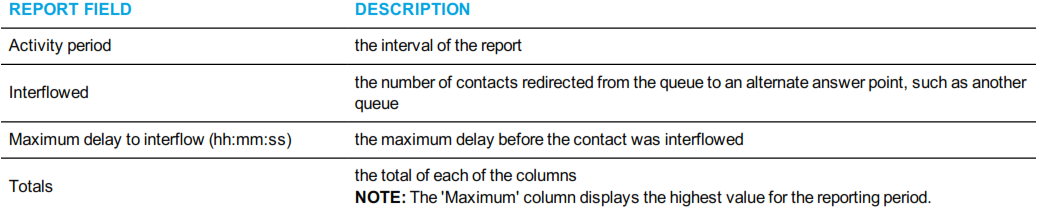
The following are the first three fields of the SMS Queue and Queue Group lnterflow Spectrum by Period reports:
The remaining fields of the SMS Queue lnterflow Spectrum by Period provide a frequency distribution of SMS patterns based on the time scale defined for the queue in YourSite Explorer. For each time period, the Count <=X Minutes field reflects the total number of SMS contacts for that interval and all preceding intervals. Queue spectrum values that cannot be rounded to whole minute values will display as decimal values with 2 places in the Count <=X Minutes report fields.
The remaining fields of the SMS Queue Group lnterflow Spectrum by Period report provide a frequency distribution of SMS patterns based on a defined time scale (Spectral lnterval 1-10). The Spectrum lnterval field reflects the total number of SMS contacts for that interval and all preceding intervals. The % of contacts interflowed field reflects the percentage of SMS contacts for that interval and all preceding intervals.
NOTE:
• For each time period, except > 120 seconds, the Count < x min field reflects the total number of SMS contacts for that interval and all preceding intervals.
• For the >120 minutes' time period, the Count < x min field reflects the total number of SMS contacts for that interval only.
• The % of Total field reflects the percentage of SMS contacts for that interval and all preceding intervals.
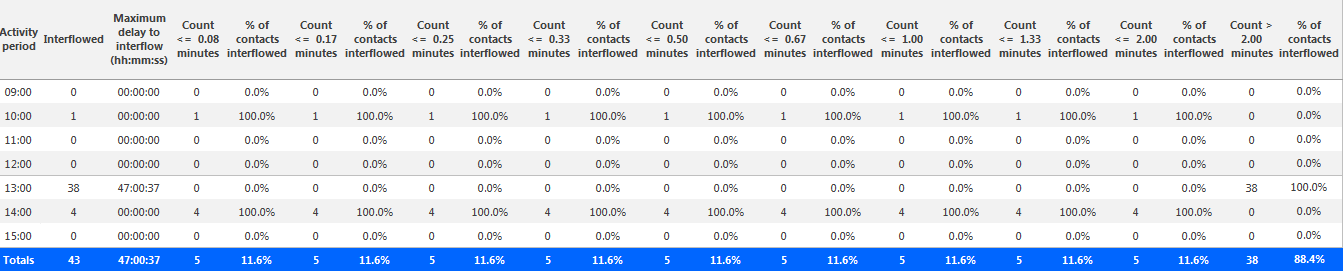
Figure 149: SMS Queue lnterflow Spectrum by Period
SMS Queue Group Answer Spectrum by Queue
The SMS Queue Group Answer Spectrum by Queue report provides a frequency distribution of SMS contacts for a queue group across intervals from 1-10. (See Figure 150.)
The following are the first three fields of the SMS Queue Group Answer Spectrum by Queue report:
The remaining fields of the SMS Queue Group Spectrum by Queue report provide a frequency distribution of SMS patterns based on a defined time scale (Spectral Interval 1-10). The Spectrum Interval field reflects the total number of SMS contacts for that interval and all preceding intervals. The % of contacts opened field reflects the percentage of SMS contacts for that interval and all preceding intervals.
NOTE: Spectrum Interval 10 reflects the total number of SMS contacts for that interval only.
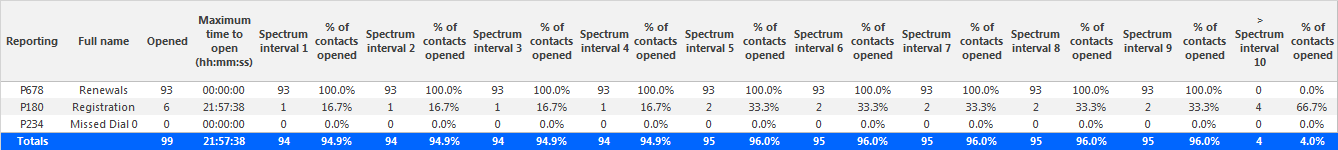
Figure 150: SMS Queue Group Answer Spectrum by Queue
SMS Queue Group Handle Spectrum by Queue
The SMS Queue Group Handle Spectrum by Queue report provides a frequency distribution of SMS contacts for a queue group across intervals from 1-10. (See Figure 151.)
The following are the first three fields of the SMS Queue Group Handle Spectrum by Queue report:
The remaining fields of the SMS Queue Group Handle Spectrum by Queue report provide a frequency distribution of SMS patterns based on a defined time scale (Spectral Interval 1-10). The Spectrum Interval field reflects the total number of SMS contacts for that interval and all preceding intervals. The % of contacts handled field reflects the percentage of SMS contacts for that interval and all preceding intervals.
NOTE: Spectrum Interval 10 reflects the total number of SMS contacts for that interval only.
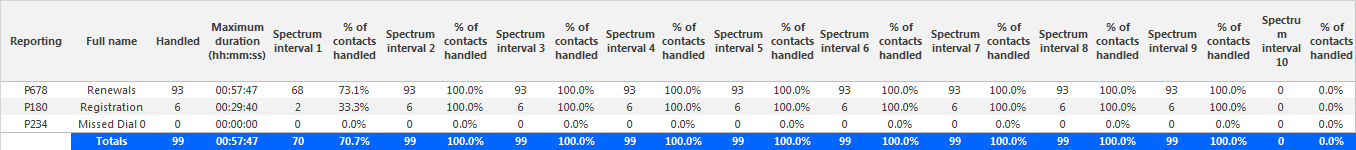
Figure 151: SMS Queue Group Handle Spectrum by Queue
SMS Queue Group lnterflow Spectrum by Queue
The SMS Queue Group lnterflow Spectrum by Queue report provides a frequency distribution of SMS contacts for a queue group across intervals from 1-10. (See Figure 152.)
The following are the first three fields of the SMS Queue Group lnterflow Spectrum by Queue report:
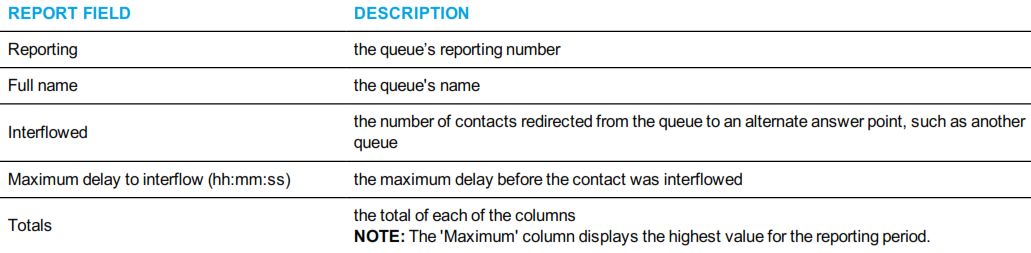
The remaining fields of the SMS Queue Group lnterflow Spectrum by Queue report provide a frequency distribution of SMS patterns based on a defined time scale (Spectral lnterval 1-10). The Spectrum lnterval field reflects the total number of SMS contacts for that interval and all preceding intervals. The % of contacts interflowed field reflects the percentage of SMS contacts for that interval and all preceding intervals.
NOTE: Spectrum lnterval 10 reflects the total number of SMS contacts for that interval only.

Figure 152: SMS Queue Group lnterflow Spectrum by Queue