MULTIMEDIA QUEUE REPORTS
Multimedia queue reports provide statistics on queues and queue groups that reflect multimedia behavior and the service experienced by clients.
The Queue reports are listed below:
• Queue Group Multimedia by Queue with Agent Information
• Queue Group Performance by Queue
• Queue Group Performance by Queue by Account Code
• Unified Queue Group Chart
NOTE: Multimedia contacts in queue tagged as Junk or No Reply from Interactive Visual Queue and Ignite are not included in queue Handled, Completed, and Offered counts.
Multimedia Queue Group Multimedia by Queue with Agent Information
The Queue Group Multimedia by Queue with Agent Information report displays performance statistics for each queue comprising a queue group. The report also displays information for agents who answered contacts from the queue, including agents who may have received contacts transferred from the queue. Supervisors can use this report to simultaneously view queue and agent statistics. (See Figure 153.)
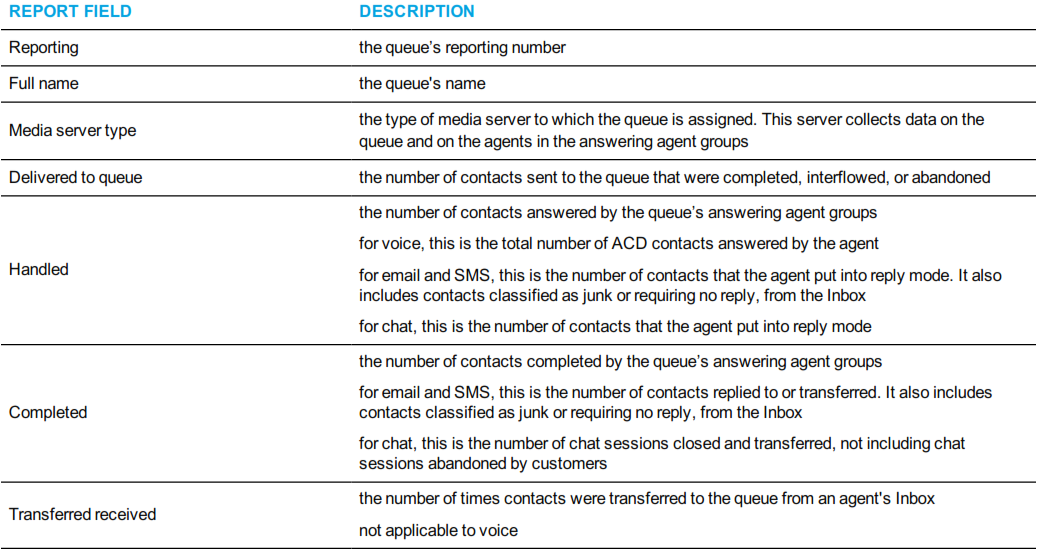
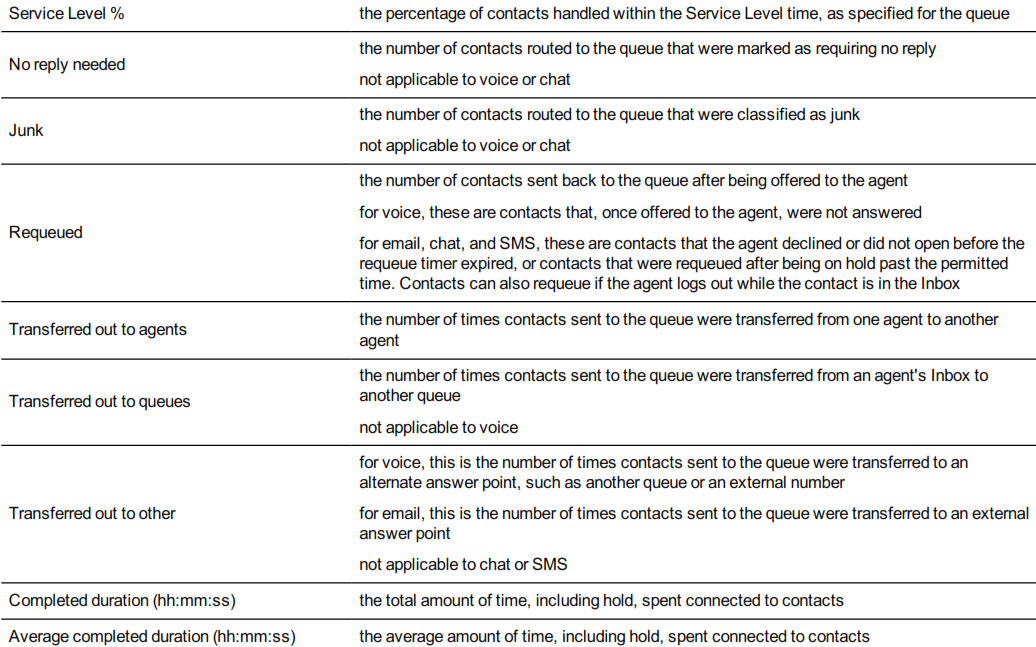
The Queue Group Multimedia by Queue with Agent Information report displays the following queue performance information.
The Multimedia Queue Group Multimedia by Queue with Agent Information report displays the following agent information.
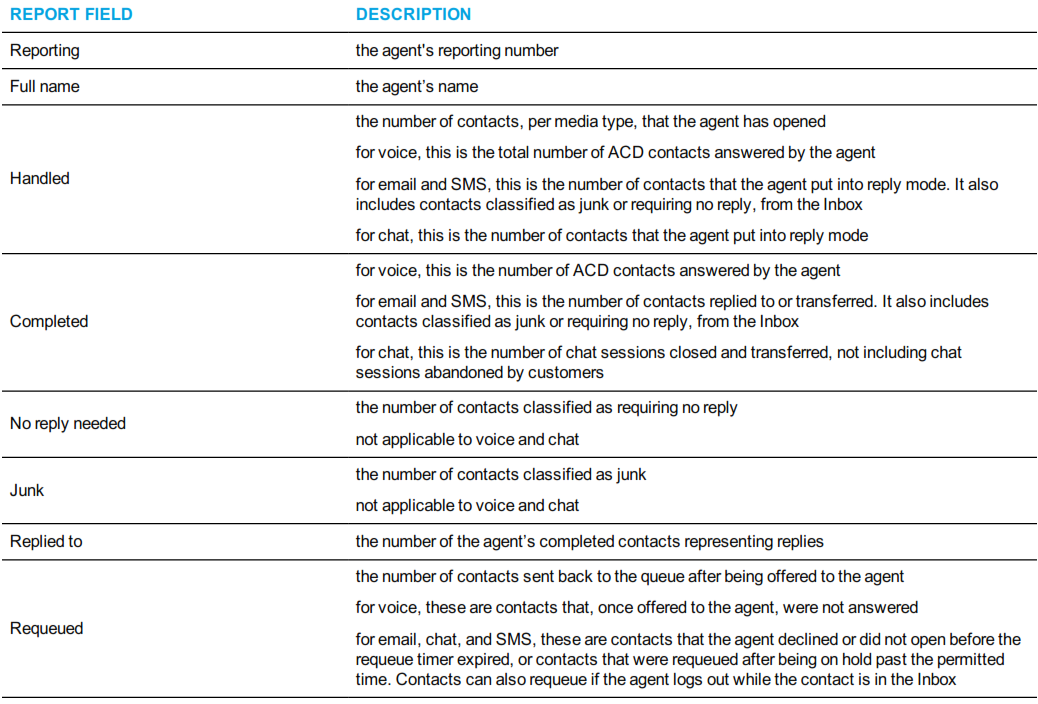

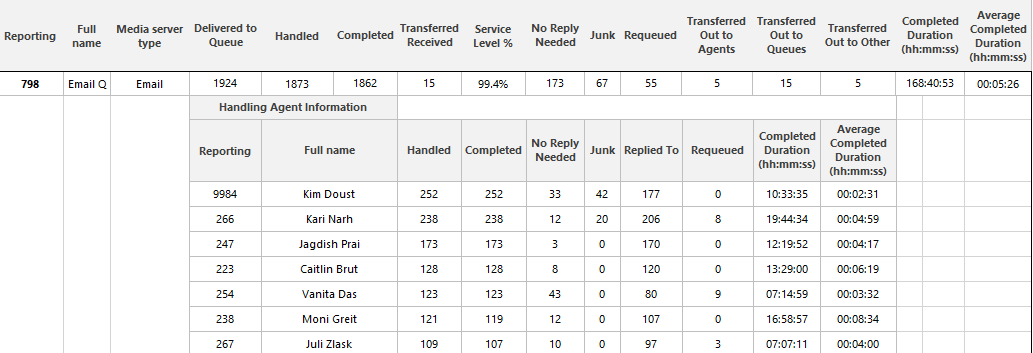
Figure 153: Multimedia Queue Group Multimedia by Queue with Agent Information
Multimedia Queue Group Performance by Queue
The Multimedia Queue Group Performance by Queue report shows handling statistics for queues comprising multimedia queue groups. (See Figure 154.)
Note that the 'Media server name' field indicates the type of contact to which the statistics pertain. For example, the queue's chat statistics are located in the same row as the chat server.
The Multimedia Queue Group Performance by Queue report provides the following information
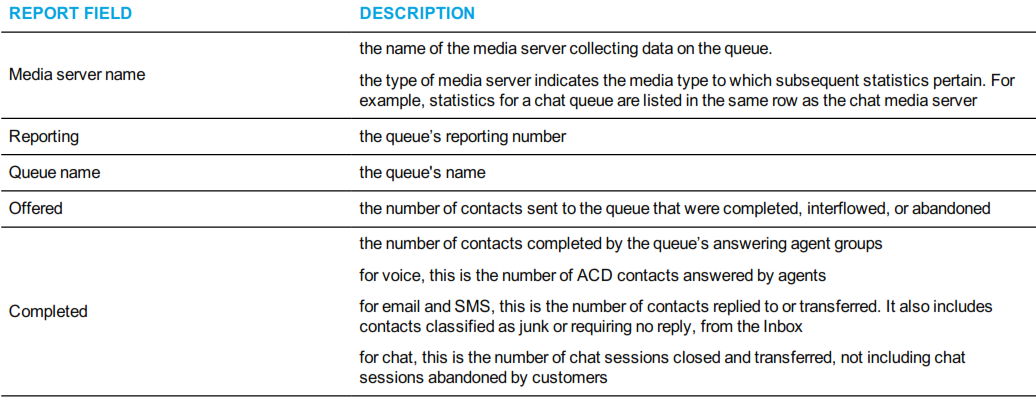
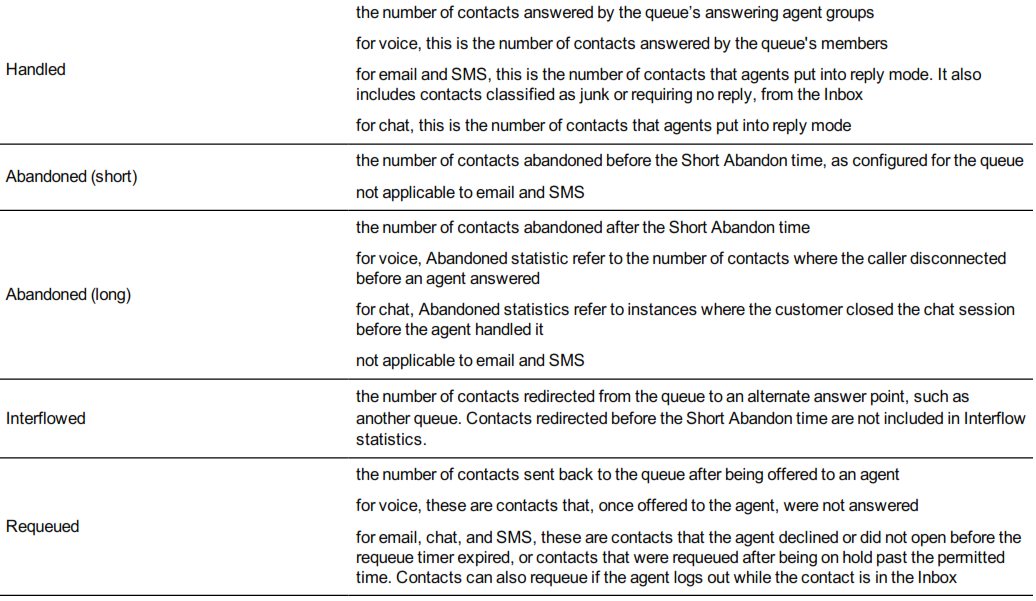
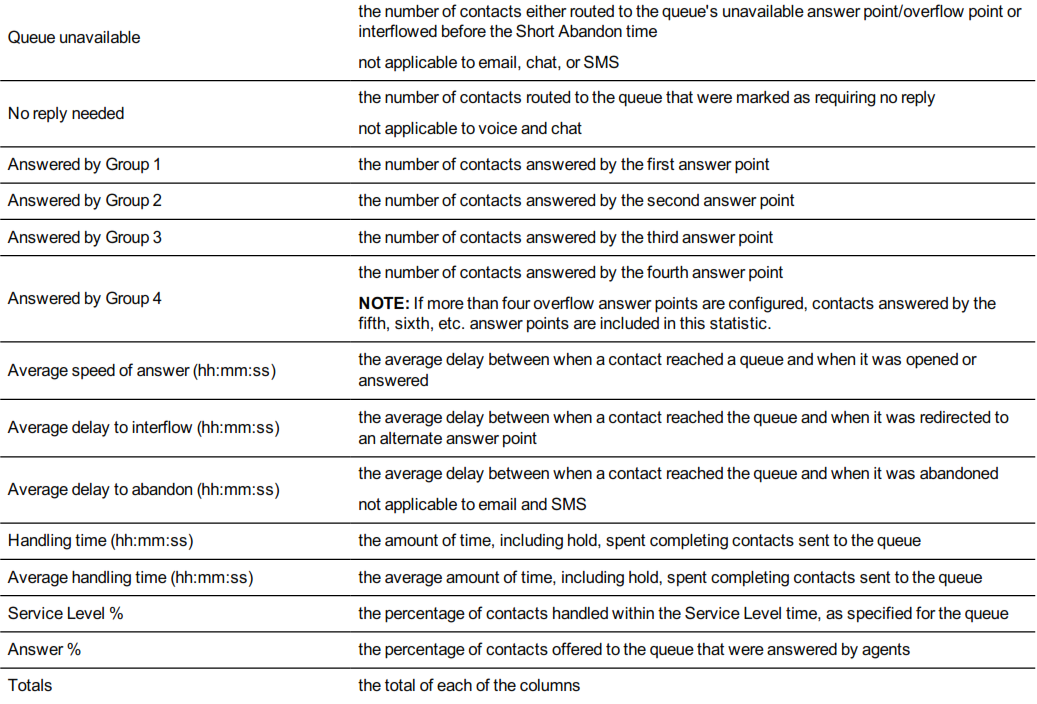
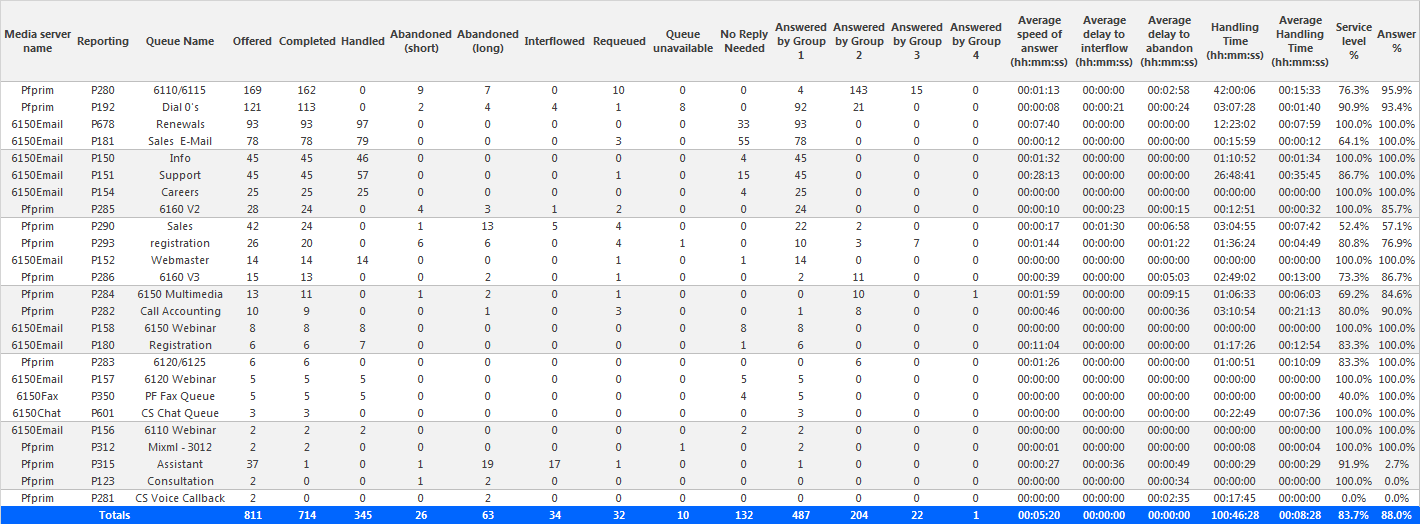
Figure 154: Multimedia Queue Group Performance by Queue
Multimedia Queue Group Performance by Queue by Account Code
The Multimedia Queue Group Performance by Queue by Account Code report displays Account Code statistics tagged on contacts routed to queues in queue groups. This report also displays the duration agents spent working on the tagged contact, until either the contact was completed or tagged with another code.
The report is broken down by the queues comprising the queue group. This enables supervisors to view performance statistics for multiple queues, within a single report. (See Figure 155.)
The Multimedia Queue Group Performance by Queue by Account Code report provides the following information.
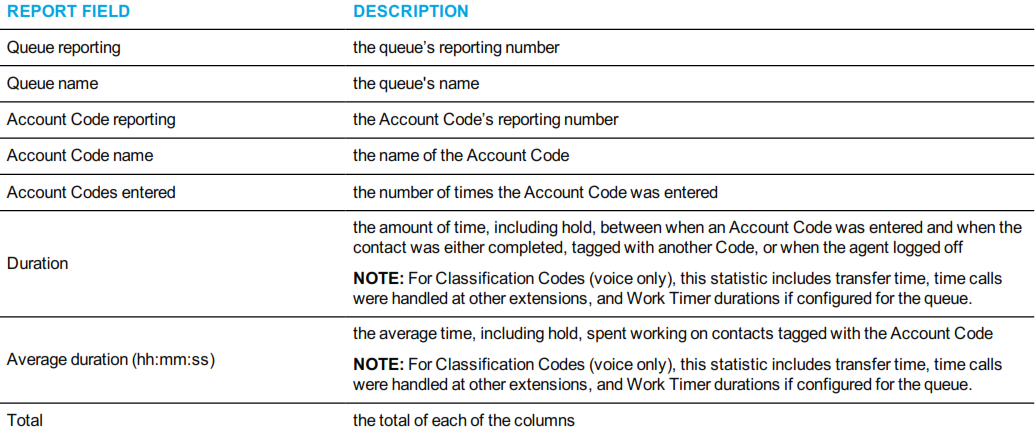
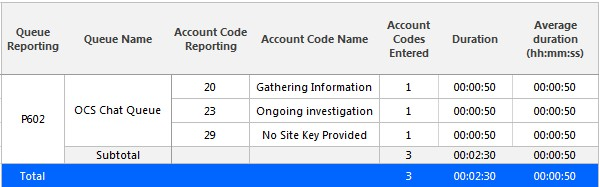
Figure 155: Multimedia Queue Group Performance by Queue by Account Code
Unified Queue Group chart
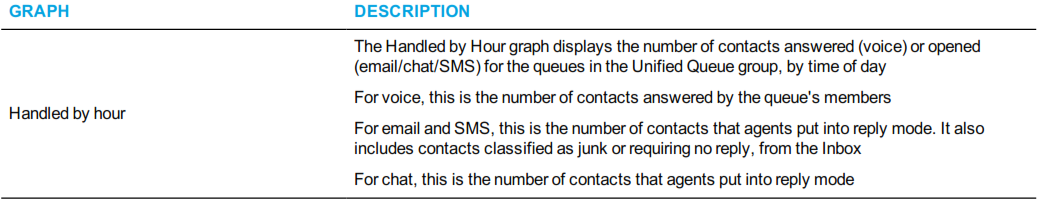
The Unified Queue Group chart displays detailed information for the queues comprising Unified Queue groups. The chart includes several graphs that enable supervisors to see, at a glance, the queues' handling, traffic, service level, and available agent statistics. The chart also indicates whether queues are meeting their Service Level targets. (See Figure 156.)
Note that media servers indicate the queues to which the statistics pertain. For example, statistics for a chat queue are indicated by a chat media server.
NOTE:
• Unified Queue Groups can contain one email, one chat, and one SMS queue only.
• In networked ACD environments, the voice media server's name in the Handled by Hour and Available Agent by Hour graphs may differ. These names are accurate to each 3300 ICP on which the devices are programmed.
The Unified Queue Group chart displays the following graphs and information.
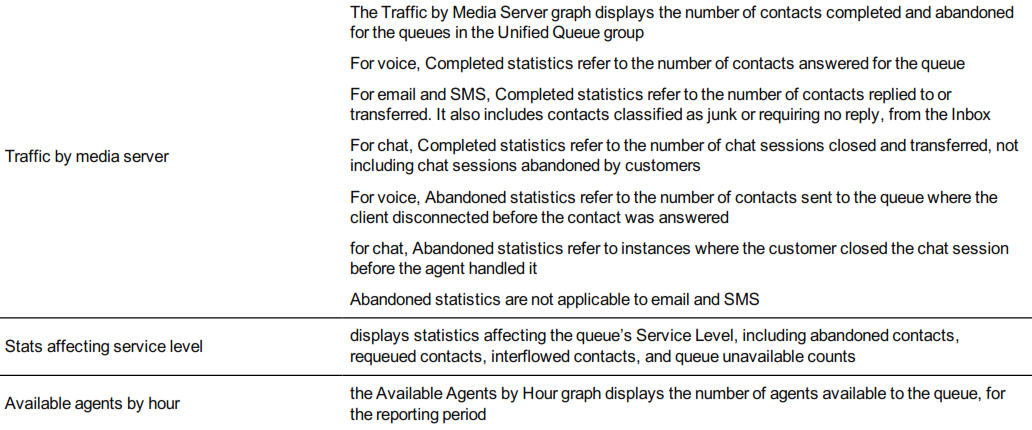
In addition to the information displayed by the graphs listed above, the Unified Queue Group chart displays the following information.

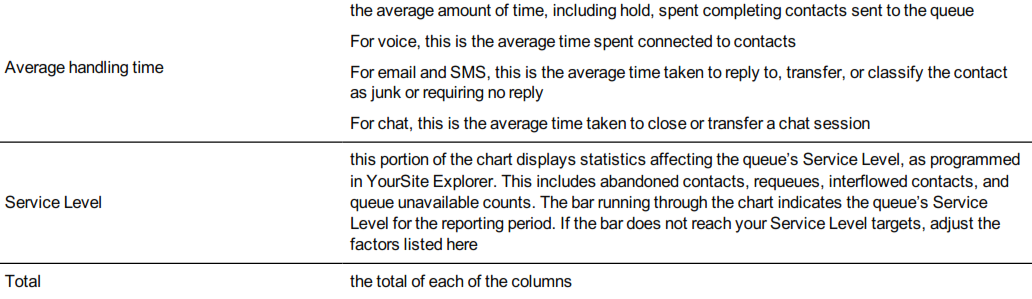
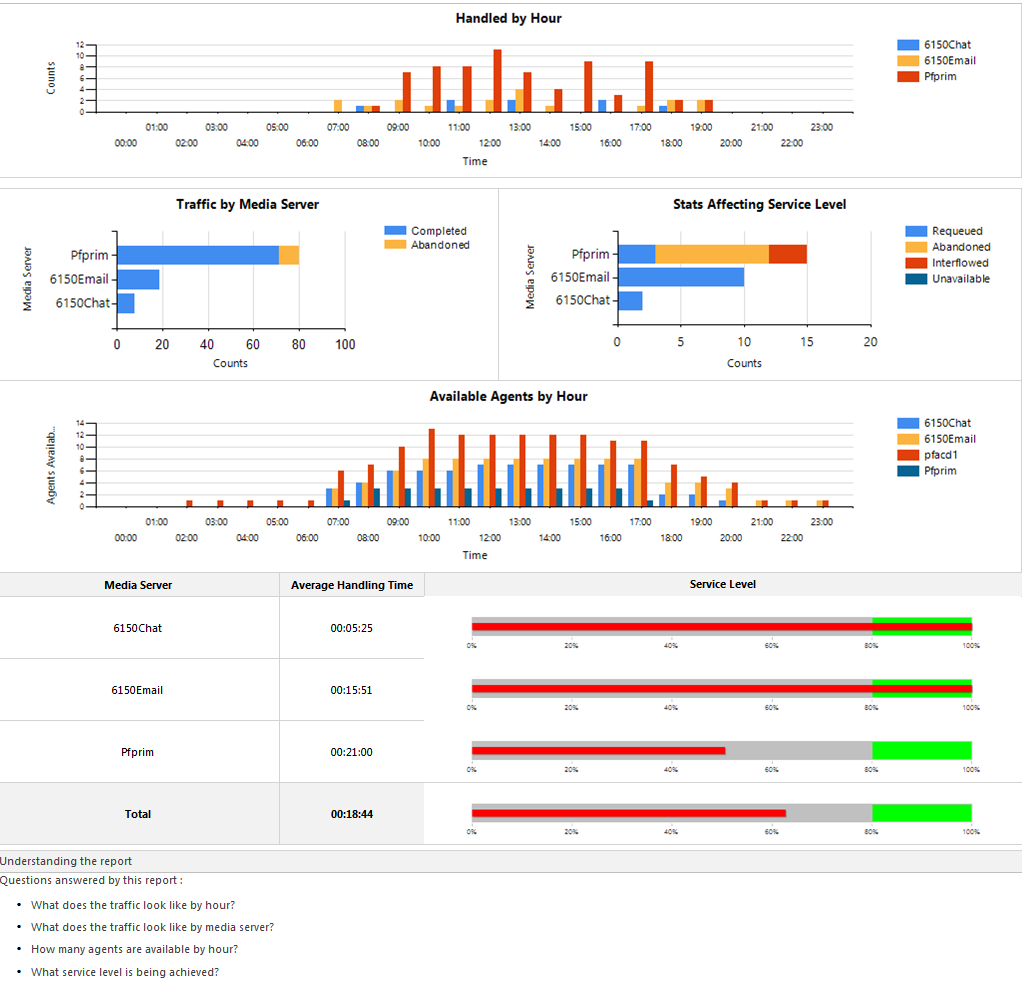
Figure 156: Unified Queue Group chart