CHAT QUEUE REPORTS
Queue and Queue Group reports provide statistics on queues and queue groups that reflect chat behavior and the service experienced by clients.
The spectrum reports provide a frequency distribution of chats abandoned, answered, or interflowed based on a defined time scale.
The Queue reports are listed below:
Performance reports
• Queue and Queue Group Performance by Account Code
• Queue Performance by Agent
• Queue and Queue Group Performance by Period
• Queue Group Performance by Queue
Spectrum reports. The spectrum reports provide a frequency distribution of chats answered or interflowed based on a defined time scale.
• Queue and Queue Group Abandon Spectrum by Period
• Queue and Queue Group Answer Spectrum by Period
• Queue and Queue Group Handle Spectrum by Period
• Queue and Queue Group Interflow Spectrum by Period
• Queue Group Abandon Spectrum by Queue
• Queue Group Answer Spectrum by Queue
• Queue Group Handle Spectrum by Queue
• Queue Group Interflow Spectrum by Queue
NOTE:
• Multimedia contacts in queue tagged as Junk or No Reply from Interactive Visual Queue and Ignite are not included in queue Handled, Completed, and Offered counts.
• If you are running a report on a queue group that has non-chat queue members, the statistical values in the generated report will be for chat queues only.
Chat Queue and Queue Group Performance by Account Code
The Chat Queue and Queue Group Performance by Account Code reports display Account Code statistics summarized by queue and queue group, respectively. Supervisors can use this report to determine how contacts are being categorized, and correlate queue or queue group traffic to the services, groups, or other elements of the organization that the Account Code represents. Supervisors can also use this report to determine how much of the time spent handling the contact pertained to the Account Code subject. (See Figure 126.)
The Chat Queue and Queue Group Performance by Account Code report provides the following information.
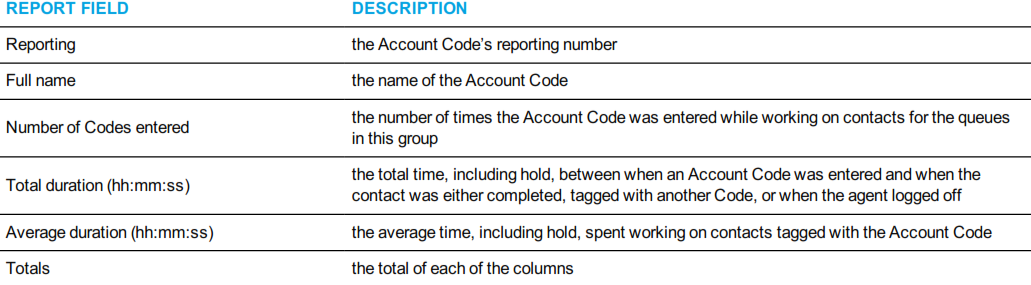
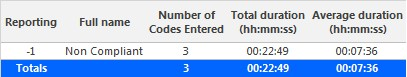
Figure 126: Chat Queue Group Performance by Account Code
Chat Queue Performance by Agent
The Chat Queue Performance by Agent report shows handling statistics for agents answering contacts for chat queues. (See Figure 127.)
The Chat Queue Performance by Agent report provides the following information.
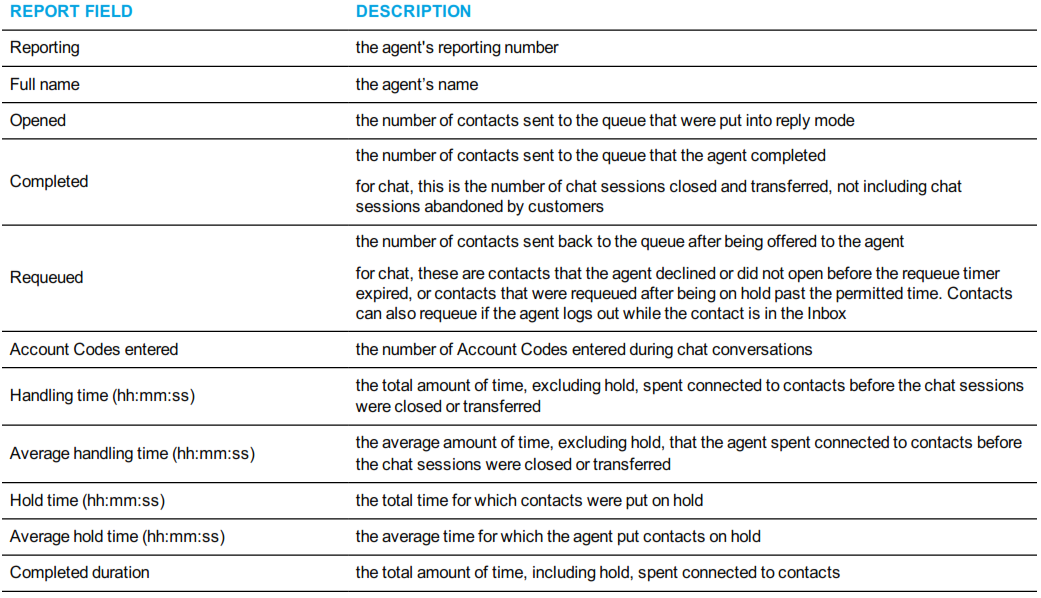

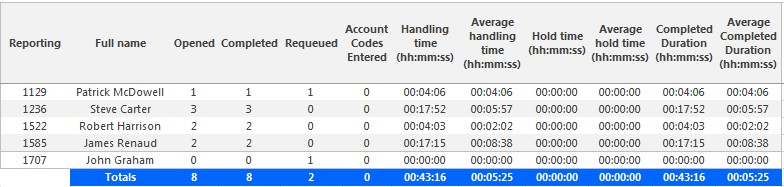
Figure 127: Chat Queue Performance by Agent
Chat Queue and Queue Group Performance by Period
The Chat Queue and Queue Group Performance by Period reports show the chat activity of a queue group across 15-, 30-, or 60-minute intervals for the shift duration and day(s) you specify. (See Figure 128.)
The Chat Queue Performance by Period reports provide the following information:
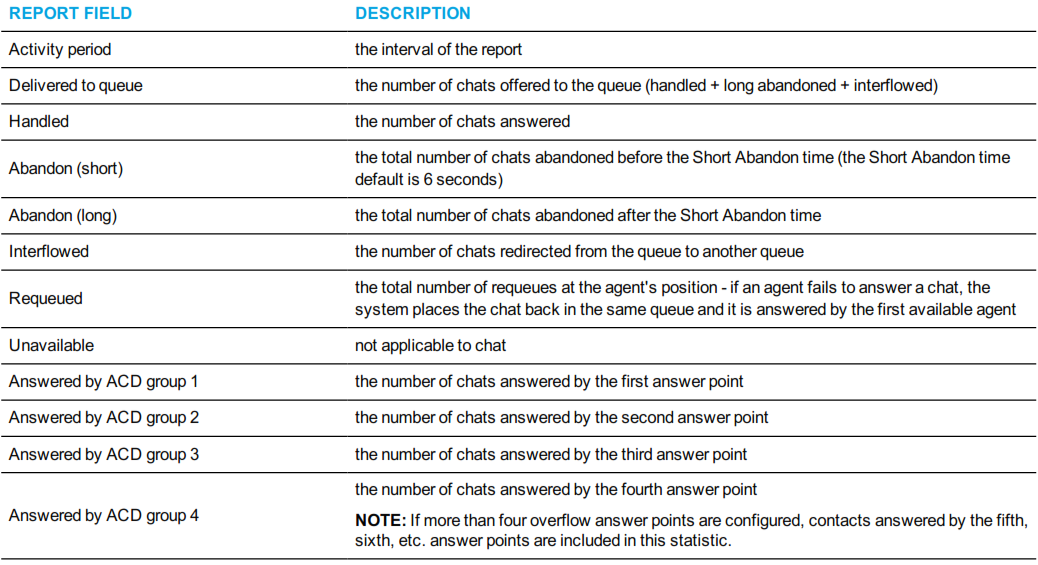
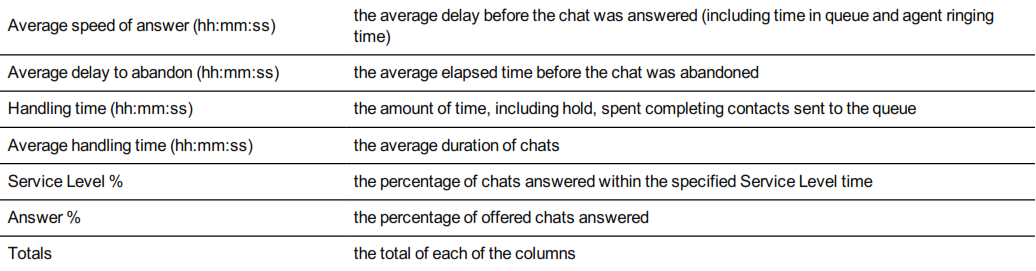
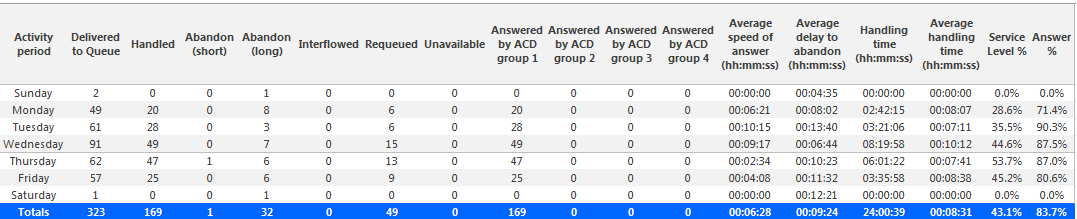
Figure 128: Chat Queue Group Performance by Period
Chat Queue Group Performance by Queue
The Chat Queue Group Performance by Queue report compares the chat workload distribution across the queues in a queue group for the shift duration and day(s) you specify. It reports the chat statistics in hours, minutes, and seconds, and provides chat counts across queues. (See Figure 129.)
The Chat Queue Group Performance by Queue report provides the following information:
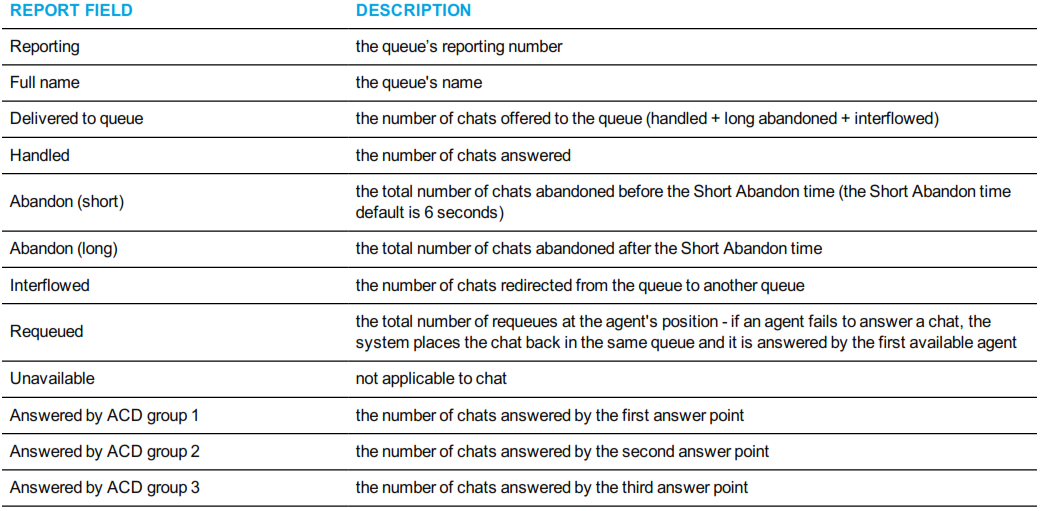
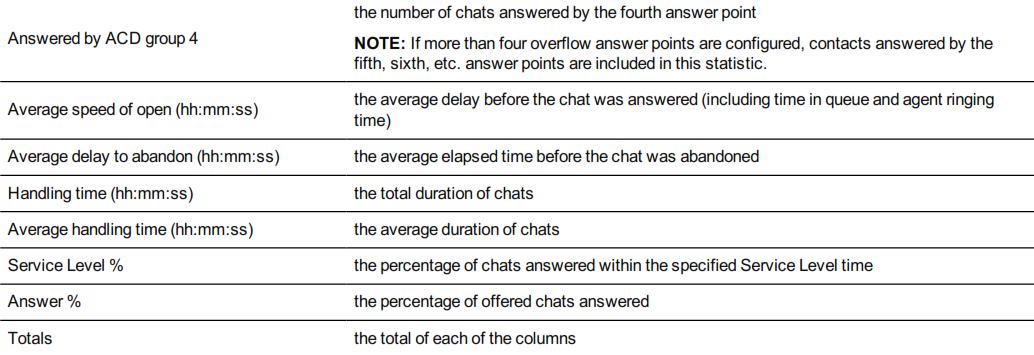
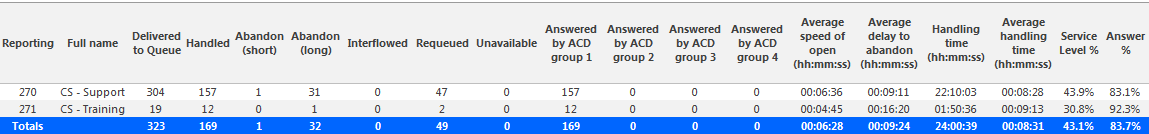
Figure 129: Chat Queue Group Performance by Queue
Chat Queue and Queue Group Abandon Spectrum by Period
The Chat Queue and Queue Group Abandon Spectrum by Period reports provide a frequency distribution of abandoned chats for queues and queue groups, across intervals for the specified period. (See Figure 130.)
NOTE: 'Day of week', 'Month', and 'Day of month' intervals have been added to the Spectrum by Period reports. Upgrading from Version 6.x to
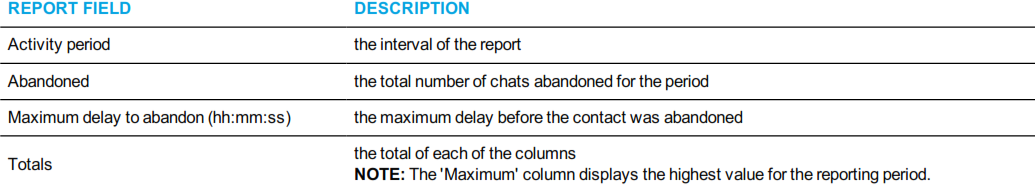
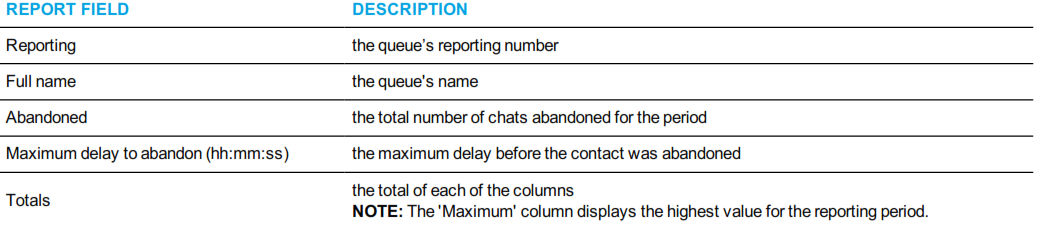
Version 7.x converts Spectrum by Day of Week reports into Spectrum by Period reports, with data displaying by day of week intervals. The following are the first three fields of the Chat Queue and Queue Group Abandon Spectrum by Period reports:
REPORT FIELD DESCRIPTION
Activity period the interval of the report
Abandoned the total number of chats abandoned for the period Maximum delay to abandon (hh:mm:ss) the maximum delay before the contact was abandoned Totals the total of each of the columns
NOTE: The 'Maximum' column displays the highest value for the reporting period.
The remaining fields of the Chat Queue and Queue Group Abandon Spectrum by Period reports provide a frequency distribution of chat patterns based on a defined time scale (5, 10, 15, 20, 30, 40, 60, 80, 120, and >120 seconds). For each time period, the Count < x sec field reflects the total number of chats for that interval and all preceding intervals. The % of contacts abandoned field reflects the percentage of chats for that interval
and all preceding intervals.
NOTE:
• For each time period, except > 120 seconds, the Count < x sec field reflects the total number of chats for that interval and all preceding intervals.
• For the >120 seconds time period, the Count < x sec field reflects the total number of chats for that interval only.
• The % of field reflects the percentage of chats for that interval and all preceding intervals.

Figure 130: Chat Queue Abandon Spectrum by Period
Chat Queue and Queue Group Answer Spectrum by Period
The Chat Queue and Queue Group Answer Spectrum by Period reports provide a frequency distribution of chats answered for queues and queue groups, across intervals for the specified period. (See Figure 131.)
NOTE: 'Day of week', 'Month', and 'Day of month' intervals have been added to the Spectrum by Period reports. Upgrading from Version 6.x to Version 7.x converts Spectrum by Day of Week reports into Spectrum by Period reports, with data displaying by day of week intervals.
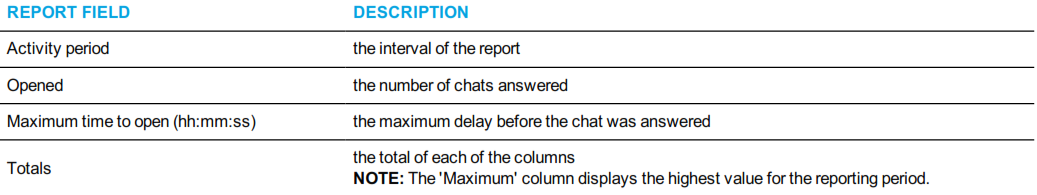
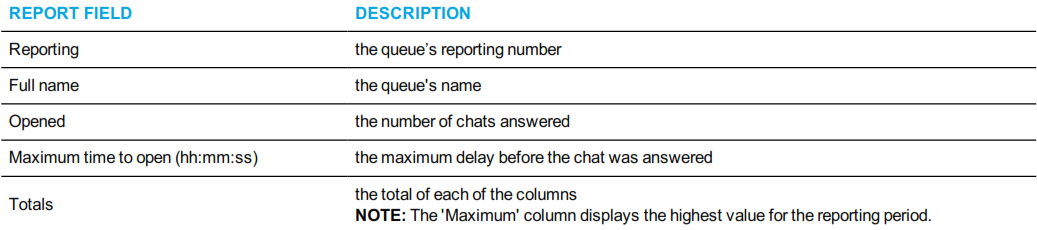
The following are the first three fields of the Chat Queue and Queue Group Answer Spectrum by Period reports:
The remaining fields of the Chat Queue and Queue Group Answer Spectrum by Period reports provide a frequency distribution of chat patterns based on a defined time scale (5, 10, 15, 20, 30, 40, 60, 80, 120, and >120 seconds). For each time period, the Count < x sec field reflects the total number of chats for that interval and all preceding intervals. The % of contacts opened field reflects the percentage of chats for that interval and all preceding intervals.
NOTE:
• For each time period, except > 120 seconds, the Count < x sec field reflects the total number of chats for that interval and all preceding intervals.
• For the >120 seconds time period, the Count < x sec field reflects the total number of chats for that interval only.
• The % of field reflects the percentage of chats for that interval and all preceding intervals.
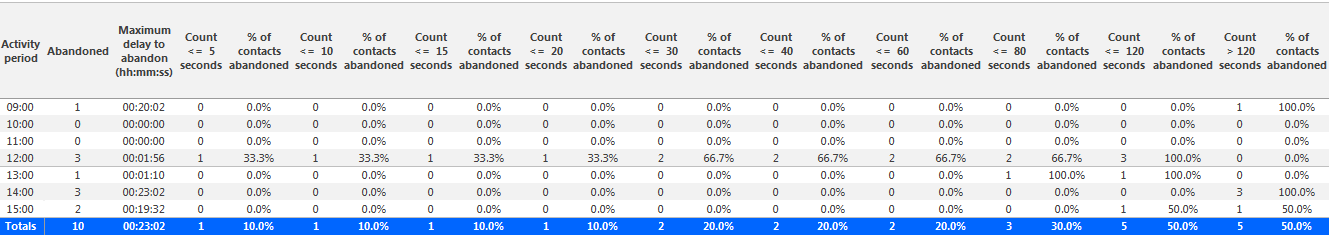
Figure 131: Chat Queue Answer Spectrum by Period
Chat Queue and Queue Group Handle Spectrum by Period
The Chat Queue and Queue Group Handle Spectrum by Period reports provide a frequency distribution of chats handled for queues and queue groups, across intervals, for the specified period. (See Figure 132.)
NOTE: 'Day of week', 'Month', and 'Day of month' intervals have been added to the Spectrum by Period reports. Upgrading from Version 6.x to Version 7.x converts Spectrum by Day of Week reports into Spectrum by Period reports, with data displaying by day of week intervals.
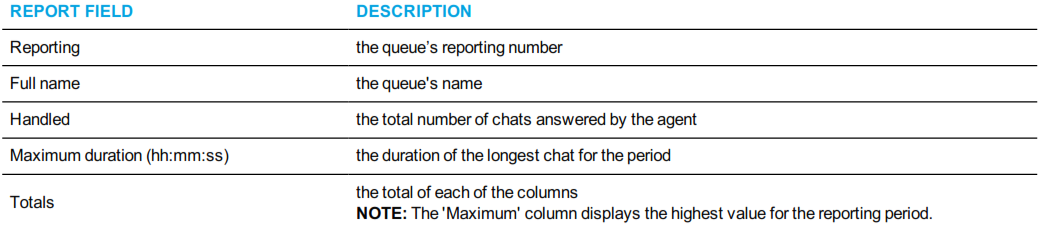
The following are the first three fields of the Chat Queue and Queue Group Handle Spectrum by Period reports:
The remaining fields of the Chat Queue and Queue Group Handle Spectrum by Period reports provide a frequency distribution of chat patterns based on a defined time scale (<10, <60, <180, <240, <300, <360, <420, <480, <540, and >541 seconds). For each time period, the Count < x sec field reflects the total number of chats for that interval and all preceding intervals. The % of contacts handled field reflects the percentage of chats for that interval and all preceding intervals.
NOTE:
• For each time period, except > 541 seconds, the Count < x sec field reflects the total number of chats for that interval and all preceding intervals.
• For the >541 seconds time period, the Count < x sec field reflects the total number of chats for that interval only.
• The % of field reflects the percentage of chats for that interval and all preceding intervals.
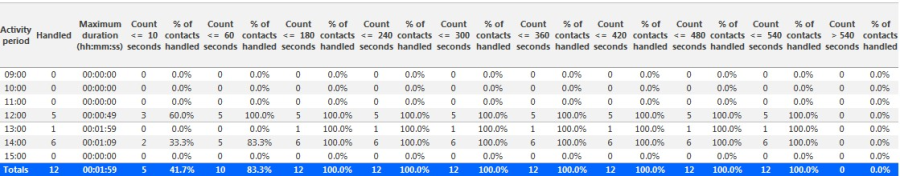
Figure 132: Chat Queue Handle Spectrum by Period
Chat Queue and Queue Group lnterflow Spectrum by Period
The Chat Queue and Queue Group lnterflow Spectrum by Period reports provide a frequency distribution of chats interflowed across queues and queue groups. The data displays in intervals for the specified period. (See Figure 133.)
NOTE: 'Day of week', 'Month', and 'Day of month' intervals have been added to the Spectrum by Period reports. Upgrading from Version 6.x to Version 7.x converts Spectrum by Day of Week reports into Spectrum by Period reports, with data displaying by day of week intervals.
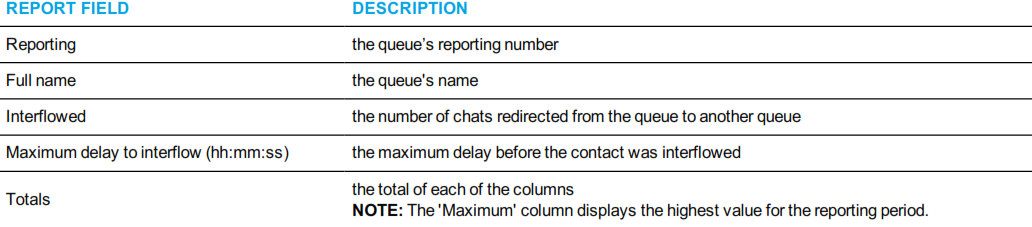
The following are the first three fields of the Chat Queue and Queue Group lnterflow Spectrum by Period reports:
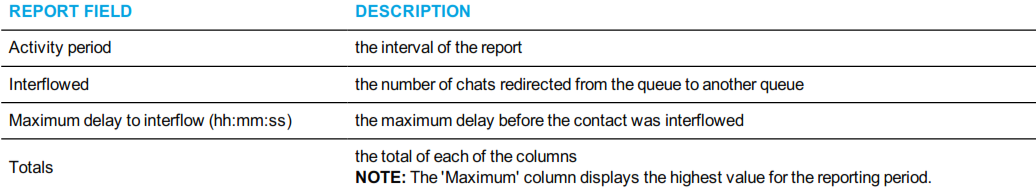
The remaining fields of the Chat Queue and Queue Group lnterflow Spectrum by Period reports provide a frequency distribution of chat patterns based on a defined time scale (5, 10, 15, 20, 30, 40, 60, 80, 120, and >120 seconds). For each time period, the Count < x sec field reflects the total number of chats for that interval and all preceding intervals. The % of contacts interflowed field reflects the percentage of chats for that interval
and all preceding intervals.
NOTE:
• For each time period, except > 120 seconds, the Count < x sec field reflects the total number of chats for that interval and all preceding intervals.
• For the >120 seconds time period, the Count < x sec field reflects the total number of chats for that interval only.
• The % of field reflects the percentage of chats for that interval and all preceding intervals.
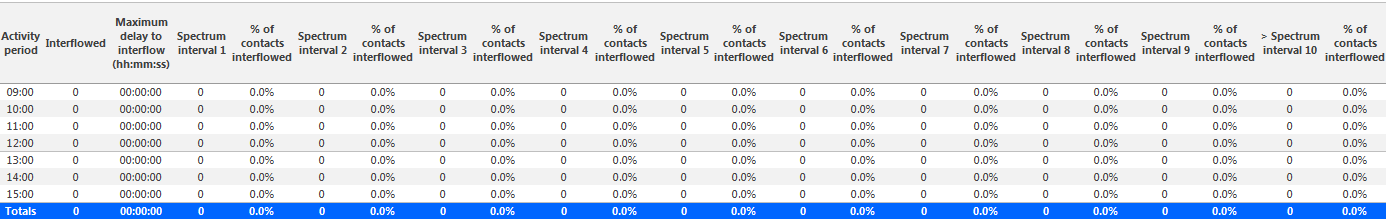
Figure 133: Chat Queue lnterflow Spectrum by Period
Chat Queue Group Abandon Spectrum by Queue
The Chat Queue Group Abandon Spectrum by Queue report provides a frequency distribution of chat handling of a queue group across intervals from 1-10. (See Figure 134.)
The following are the first four fields of the Chat Queue Group Abandon Spectrum by Queue report:
The remaining fields of the Chat Queue Group Abandon Spectrum by Queue report provide a frequency distribution of chat patterns based on a defined time scale (Spectral Interval 1-10). The Spectrum Interval field reflects the total number of chats for that interval and all preceding intervals. The % of contacts abandoned field reflects the percentage of chats for that interval and all preceding intervals.
NOTE: Spectrum Interval 10 reflects the total number of chats for that interval only.

Figure 134: Chat Queue Group Abandon Spectrum by Queue
Chat Queue Group Answer Spectrum by Queue
The Chat Queue Group Answer Spectrum by Queue report provides a frequency distribution of chat handling of a queue group across intervals from 1-10. (See Figure 135.)
The following are the first four fields of the Chat Queue Group Answer Spectrum by Queue report:
The remaining fields of the Chat Queue Group Answer Spectrum by Queue report provide a frequency distribution of chat patterns based on a defined time scale (Spectral Interval 1-10). The Spectrum Interval field reflects the total number of chats for that interval and all preceding intervals. The % of contacts opened field reflects the percentage of chats for that interval and all preceding intervals.
NOTE: Spectrum Interval 10 reflects the total number of chats for that interval only.

Figure 135: Chat Queue Group Answer Spectrum by Queue
Chat Queue Group Handle Spectrum by Queue
The Chat Queue Group Handle Spectrum by Queue report provides a frequency distribution of chat handling of a queue group across intervals from 1-10. (See Figure 136.)
The following are the first four fields of the Chat Queue Group Handle Spectrum by Queue report:
The remaining fields of the Chat Queue Group Handle Spectrum by Queue report provide a frequency distribution of chat patterns based on a defined time scale (Spectral Interval 1-10). The Spectrum Interval field reflects the total number of chats for that interval and all preceding intervals. The % of contacts handled field reflects the percentage of chats for that interval and all preceding intervals.
NOTE: Spectrum Interval 10 reflects the total number of chats for that interval only.

Figure 136: Chat Queue Group Handle Spectrum by Queue
Chat Queue Group lnterflow Spectrum by Queue
The Chat Queue Group lnterflow Spectrum by Queue report provides a frequency distribution of chat handling of a queue group across intervals from 1-10. (See Figure 137.)
The following are the first four fields of the Chat Queue Group lnterflow Spectrum by Queue report:
The remaining fields of the Chat Queue Group lnterflow Spectrum by Queue report provide a frequency distribution of chat patterns based on a defined time scale (Spectral lnterval 1-10). The Spectrum lnterval field reflects the total number of chats for that interval and all preceding intervals. The % of contacts interflowed field reflects the percentage of chats for that interval and all preceding intervals.
NOTE: Spectrum lnterval 10 reflects the total number of chats for that interval only.

Figure 137: Chat Queue Group lnterflow Spectrum by Queue